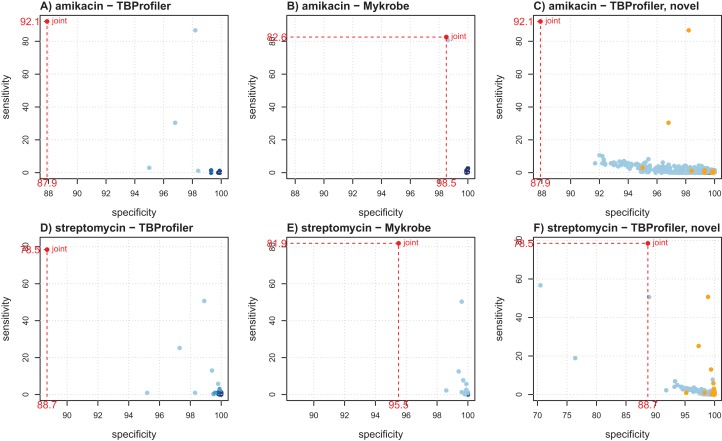
Figure 2. Illustration of individual markers performance for amikacin (A–C) and streptomycin (D–F), in terms of sensitivity and specificity.
(A and D) TBProfiler markers; (B and E) Mykrobe markers; (C and F) novel mutations identified by TBProfiler (in blue), together with the original mutations (orange). The values shown in red correspond to the overall performance of the tools. No minimum frequency threshold is considered to call a marker present.

