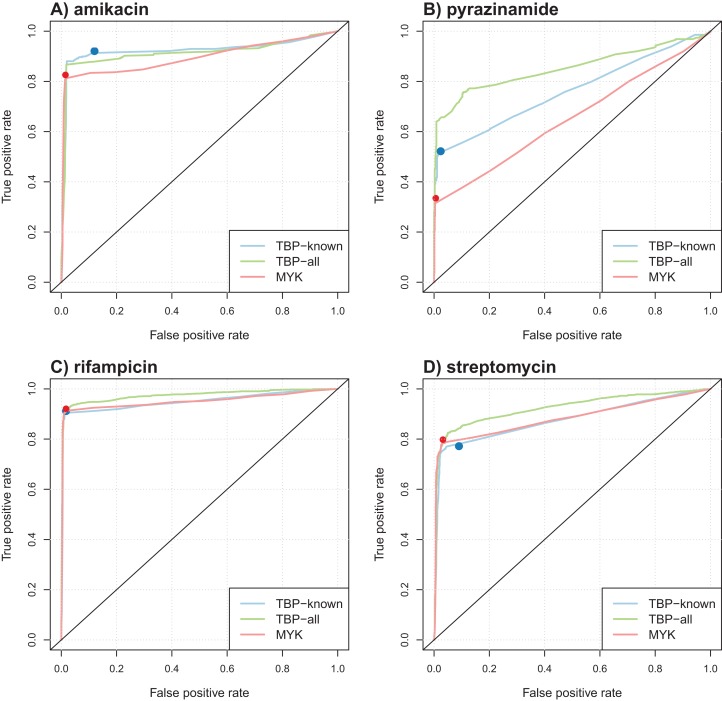
Figure 3. Illustration of ROC curves obtained by L1-penalized logistic regression using TBProfiler and Mykrobe markers, for amikacin (A), pyrazinamide (B), rifampicin (C) and streptomycin (D).
The TBP-known model is built using the TBProfiler known markers only, the TBP-all model using the known and the novel mutations identified by TBProfiler, and the MYK model using the Mykrobe markers. The red and blue dots represent performances respectively obtained by TBProfiler and Mykrobe softwares under the same cross-validation process.

