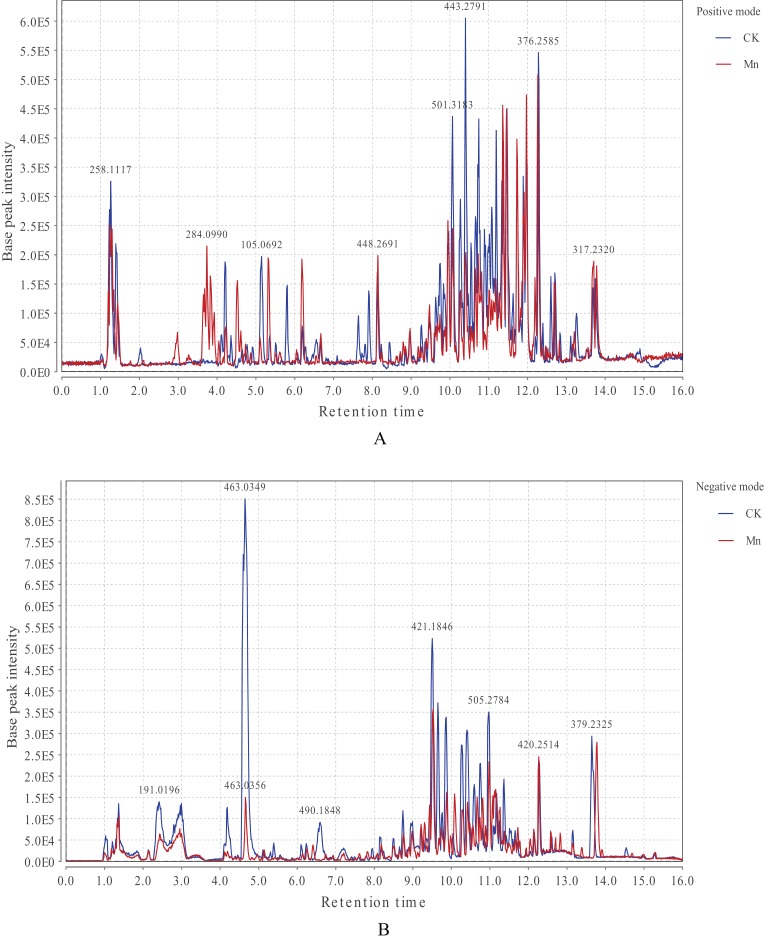
Figure 1. LC-MS base peak chromatograms of CK (in blue) and Mn (in red) samples in positive (A) and negative ionization mode (B).
CK, the control group without MnSO4 addition; Mn, the treatment group with 200 mg/kg MnSO4 addition. X-axis represents the retention time, and Y-axis represents base peak intensity. The figure displays the detected peaks in positive (A) and negative (B) ionization modes. The strongly detected molecules of metabolites in G. lucidum fruiting bodies exhibited a decrease or an increase between the control and the Mn-treated samples.

