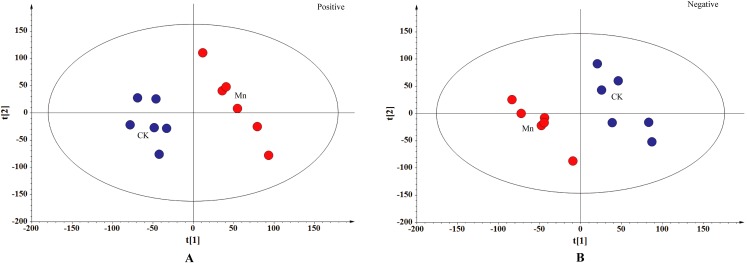
Figure 2. PLS-DA score plot.
CK, the control group without MnSO4 addition; Mn, the treatment group with 200 mg/kg MnSO4 addition. The control samples were in blue and the Mn-treated samples in red. (A) Positive ionization mode, R2X[1] = 0.157, R2X[2] = 0.156, Ellipse: Hotelling’s T2 (95%); (B) negative ionization mode, R2X[1] = 0.183, R2X[2] = 0.136, Ellipse: Hotelling’s T2 (95%). PLS-DA analysis is to distinguish the different metabolites between the Mn-treated and control samples of G. lucidum.

