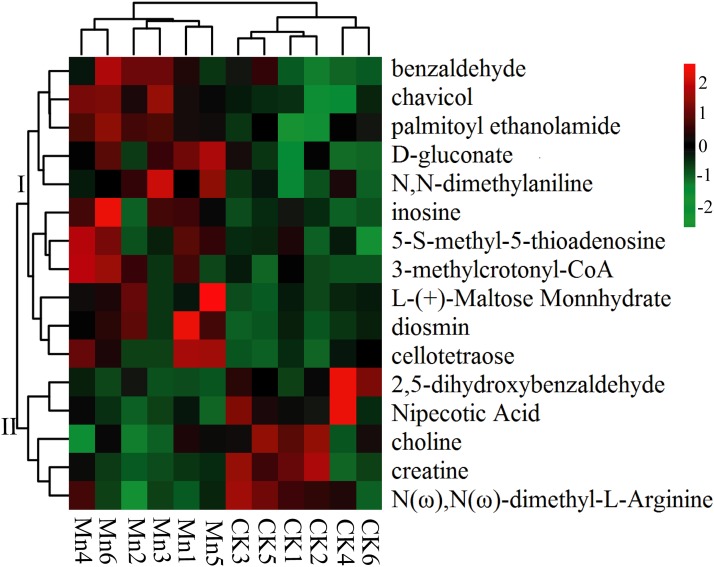
Figure 4. Heat map of significantly differential metabolites.
CK, the control group without MnSO4 addition; Mn, the treatment group with 200 mg/kg MnSO4 addition. There are six duplications in each treatment. The samples were subject to bidirectional clustering analysis using the R package Pheatmap based on the euclidean distance and complete linkage clustering. The up-expressed metabolites are colored in red and the down-regulated metabolites in green, respectively. The heat map presents and groups all the significantly differential metabolites.

