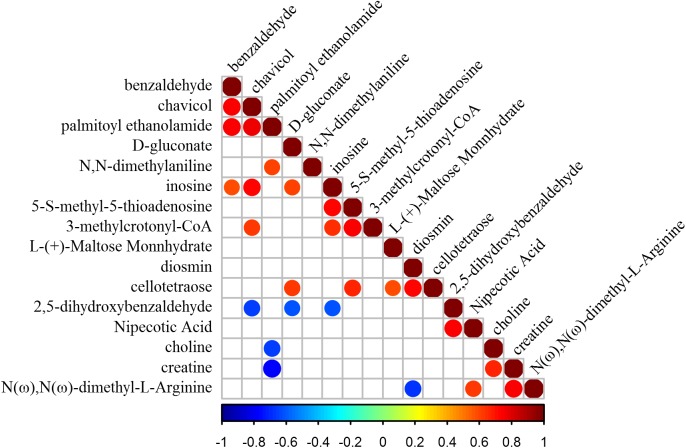
Figure 5. Correlation heat map of differential metabolites.
The blank squares showed no relevance between differential metabolites based on the statistical test (p-value > 0.05). The squares with color markings showed mutual promotion or inhibition relationships between differential metabolites (p-value < 0.05).

