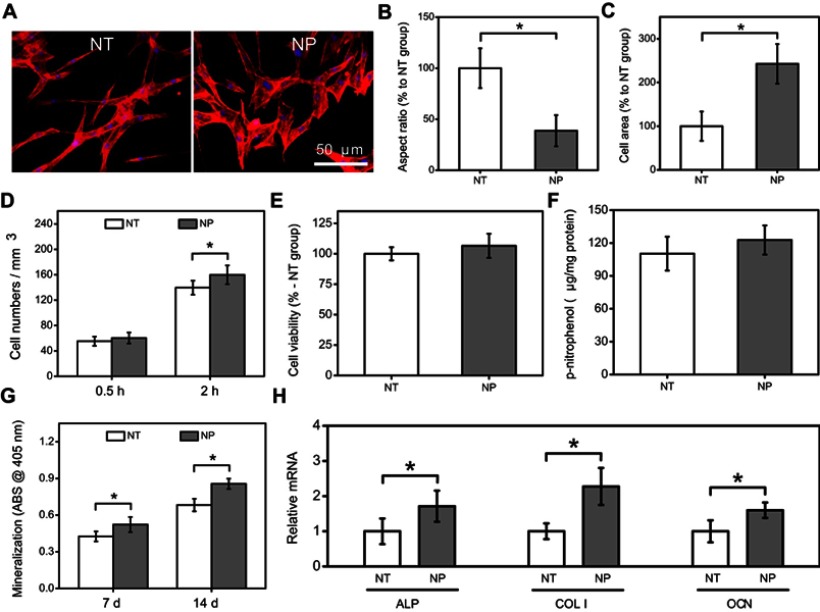
Figure 3.
(A) Morphology of MC3T3-E1 cells on NT and NP substrates; statistics of cell aspect ratio (B) and area (C) according to morphology images; (D) early adhesion of MC3T3-E1 cells at 0.5 and 2 hrs; (E) cell viability, (F) ALP activity, (G) mineralization level and (H) osteogenic genes expression of MC3T3-E1 cells at 7 and/or 14 d. Error bars represent mean±SD for n=6, *p<0.05.

