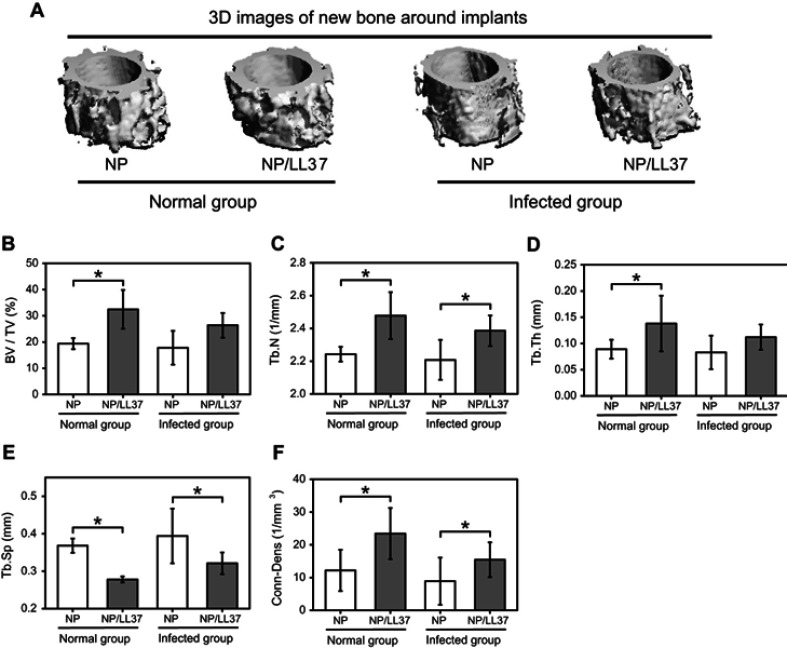
Figure 7.
(A) 3D images of new bone in normal and infected NP and NP/LL37 groups after implantation for 8 weeks; statistics of bone volume fraction (BV/TV) (B), trabecular number (Tb.N) (C), trabecular thickness (Tb.Th) (D), trabecular separation (Tb.Sp) (E) and connectivity density (Conn-Dens) (F). Error bars represent mean ± SD for n = 8, *p < 0.05.

