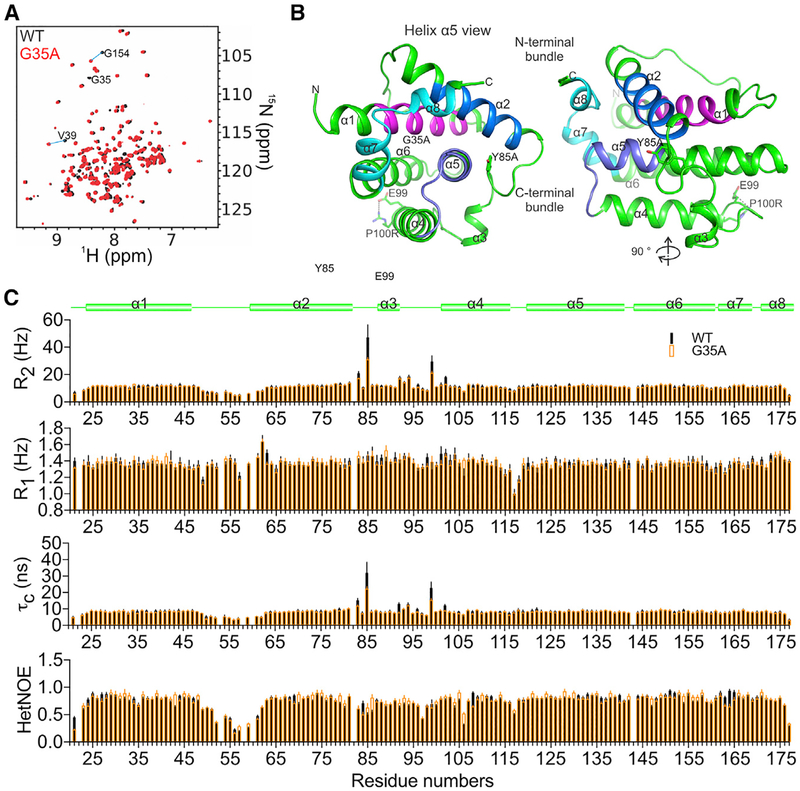
Figure 2. NMR Structure of Human BOK Reveals a Typical BCL-2 Core.
(A) Overlay of 1H-15N TROSY spectra of the BCL-2 core of BOK, PR3CA ΔN20-BOK-ΔC35, and the G35A mutant, with some assignments illustrating chemical shift perturbation between the two.
(B) Cartoon representation of the NMR structure of the BCL-2 core of BOK. BH1–BH4 regions are colored as in Figure 1A.
(C) Protein dynamics analyses including backbone 1H-15N transverse (R2) and longitudinal (R1) relaxation and hetNOE analysis of WT and G35A PR3CA revealed two flexible regions, the α1–α2 and the α2–α4 connecting regions, both having hetNOE values lower than the domain average. The R2, R1, and τc analyses indicated that the α1–α2 and α2–α4 connecting regions had faster and slower motions than the domain average, respectively, suggesting nanosecond to picosecond dynamics for the former and chemical (conformational) exchange microsecond to millisecond dynamics for the latter. The unique properties of the α2–α4 connecting region, which also harbors the short helix α3, likely contribute to the overall meta-stability of BOK. The stabilizing G35A mutant in helix a1 reduces but does not abolish the dynamics in the α2–α4 connecting region, suggesting a global effect on BOK metastability.
See also Figure S2.

