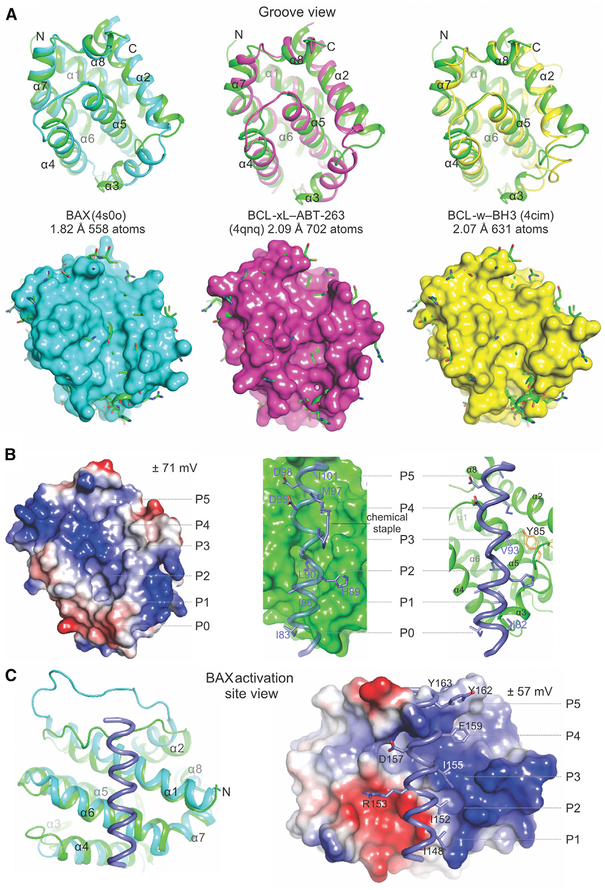
Figure 3. Structural Comparison Reveals Possible Gating of BH3 Ligand Access to the Atypical Hydrophobic Groove of BOK.
(A) Alignment of the BCL-2 core of BOK (green) and that of BAX, BCL-xL, and BCL-w completed in PyMOL. The root-mean-square deviation is indicated for the total number of atoms used in the alignment. Top: cartoon representations indicate major deviations in alignments in the region connecting helices α2–α4, which defines the atypical groove of BOK. Bottom: cartoon-and-stick representations of BOK protruding through the surface representation of the aligning partner. Clashes with incoming hydrophobic ligands are predicted throughout the hydrophobic groove of BOK.
(B) The atypical hydrophobic groove of BOK is shown in the apo configuration or interacting with the BID BH3 from the BID SAHB-BAK complex (2m5b.pdb). Left: the electrostatic potential plotted on the surface of BOK. Middle and right: the putative clashes of the BID BH3 ligand at the groove of BOK. The chemical staple of the BID SAHB was excluded (right). The putative hydrophobic pockets are designated as P0–P5.
(C) The alignment of BOK and the BAX-BIM SAHB complex showing a view of the activation site of BAX engaged by BIM SAHB. The predicted structural clashes and electrostatic incompatibilities of BIM SAHB and BOK at this site are illustrated in the surface-cartoon representation, suggesting that their interaction is disfavored. See also Figure S3.

