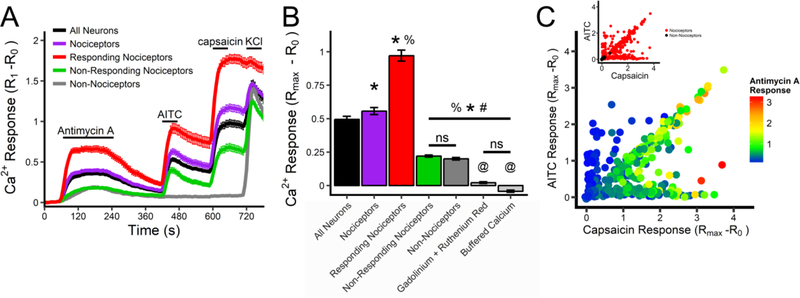
Fig 2:
Antimycin A evokes Ca2+ influx in a subset of vagal sensory neurons. A, Mean +/− SEM [Ca2+]i responses in vagal neuronal subsets to antimycin A (10μM), AITC (100μM), capsaicin (1μM) and KCl (75mM). Subsets defined by their expression of tdTomato, their sensitivity to TRP channel agonists and their response to antimycin A: all neurons (black line), all nociceptors (purple line), nociceptors responding to antimycin A (red line), nociceptors insensitive to antimycin A (green line) and non-nociceptors (grey line). B, Mean maximal [Ca2+]i response to antimycin A for each subset. Light grey columns represent data from all neurons in pretreated with ruthenium red (30 μM) and Gd3+ (300 μM), or with extracellular [Ca2+] buffered to 100nM. * denotes significant different from all neurons population (p<0.05), % denotes significant difference from all nociceptor population (p<0.05), # denotes significant difference from ‘responding’ nociceptor population (p<0.05), @ denotes significant difference from nonnociceptive population (p<0.05), ns denotes no significant difference. C, Maximal [Ca2+]i response to antimycin A (rainbow color range), AITC (y axis) and capsaicin (x axis) for each neuron from the entire vagal population. Inset, maximal [Ca2+]i response to AITC and capsaicin for each tdTomato-positive (red dot) and each tdTomato-negative (black dot) neuron.

