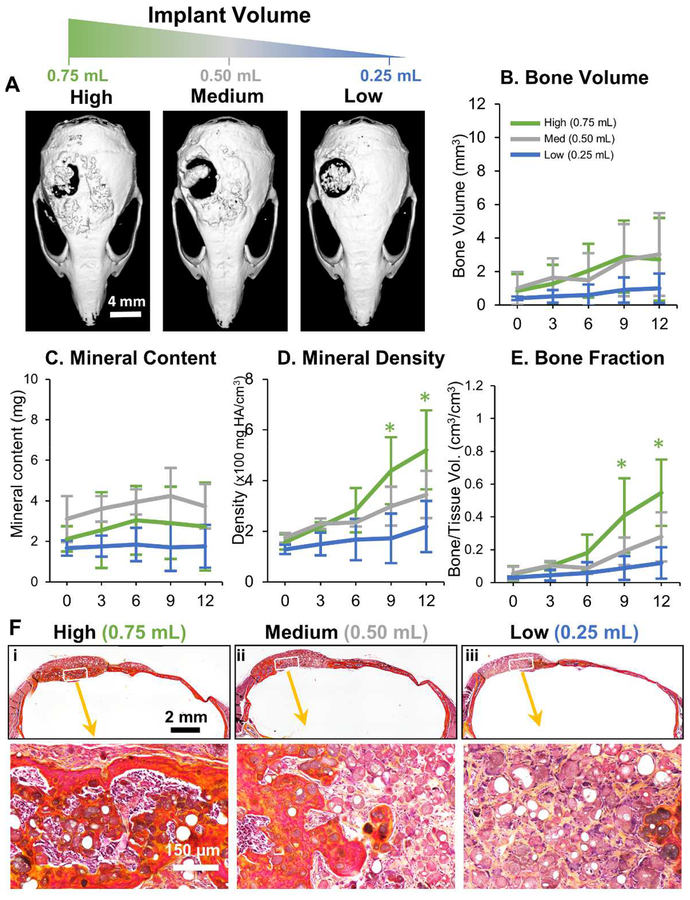
Figure 3 -. Influence of microtissue implant volume on bone formation.
A) Representative microCT images of bone formation in the defect region at 12 weeks. MicroCT data were analyzed to specifically assess new bone within the 4 mm defect site across implant replicates, and to obtain quantitative measures of: B) total bone volume, C) mineral content, D) mineral density, and E) bone volume fraction (bone volume/tissue volume). F) Histology images of newly formed bone in the defect site using Movat’s pentachrome staining. (Collagen fibers = yellow; fibrin = bright red; nuclei = purple-black).

