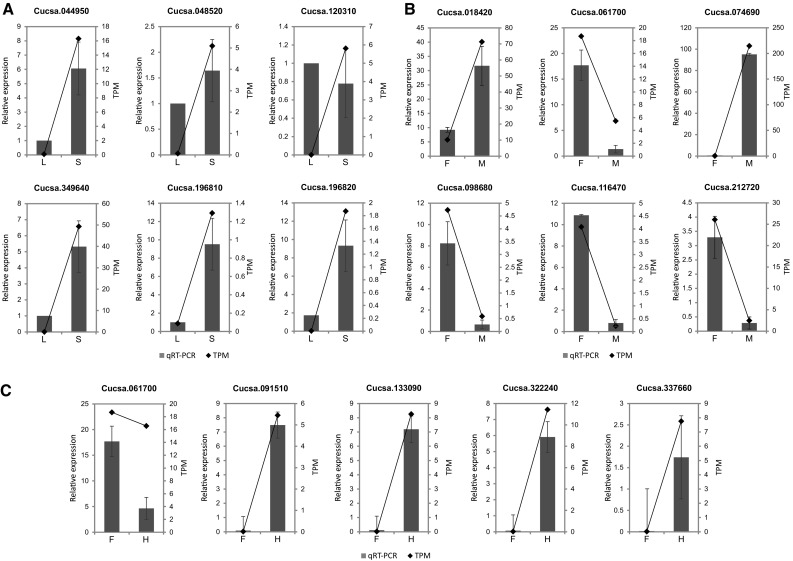
Fig. 4.

Validation of DEG analyses by quantitative PCR [qPCR: relative expression; RNA-seq: transcripts per million (TPM)]. a Genes differentially expressed between vegetative (L, leaves) and generative (S, shoots) tissues. b Genes differentially expressed between female (F) and male (M) shoots. c Genes differentially expressed between female (F) and hermaphroditic (H) shoots
