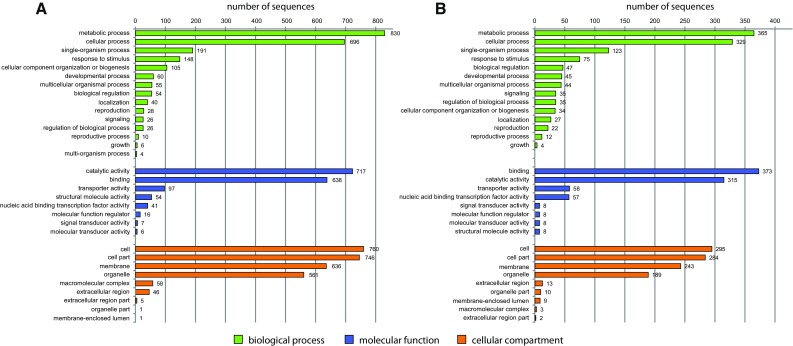
Fig. 5.

Histogram of GO analysis of DEGs detected in the comparison between leaves and the shoot apex. a Genes exhibiting upregulated expression in leaves (1919). b Genes exhibiting upregulated expression in the shoot apex (933)

Histogram of GO analysis of DEGs detected in the comparison between leaves and the shoot apex. a Genes exhibiting upregulated expression in leaves (1919). b Genes exhibiting upregulated expression in the shoot apex (933)