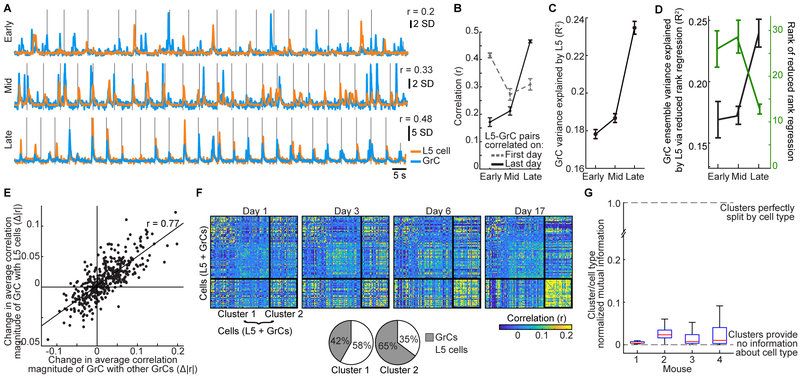
Figure 6. Shared Cortico-cerebellar Dynamics Emerge Over Learning.
(A) Example L5-GrC pair strongly correlated late in learning was poorly correlated early in learning. Vertical lines denote onset of individual turn motions.
(B) L5-GrC pairs that were highly correlated on the last day were weakly correlated early in learning (solid trace; p<10−6 Wilcoxon signed-rank test, n=121 pairs with last-day correlations >0.4). Dashed trace shows the evolution of correlations for pairs with high correlations early in learning. The initial correlation for last-day-correlated pairs was weaker than the final correlation of first-day-correlated pairs (p=3 ×10⁻⁶ Wilcoxon rank sum test, n=61 pairs early learning correlations >0.4).
(C) The accuracy with which L5 population activity reproduced the fluorescence of each GrC via linear regression rose over learning (curves show mean±SEM across GrCs; p<10−6 comparing early and late learning, Wilcoxon rank sum test).
(D) The single-trial activity of all GrCs was simultaneously reproduced via linear reduced rank regression using L5 population activity. Regression accuracy rose over learning (black), while the average rank (dimensionality) of the L5-GrC regression fell (green; curves show mean±SEM across imaging sessions from 7 mice).
(E) For each GrC (represented by a dot), the change in its average correlation magnitude to all other GrCs (x-axis) strongly covaried with the change in its correlation to all L5 cells (n=398 GrCs tracked over learning).
(F) Matrix of correlation coefficients between each pair of neurons for 4 days between early and late learning in one mouse (n=55/53 L5 cells/GrCs). K-means clustering (k=2) identified groups of neurons that together exhibited similar changes in correlation to all other neurons over learning. Clustering was applied to the differences in correlation coefficients between Day 17 and Day 1. The thick solid black outlines in the matrix show the resulting clusters. The neurons are sorted in the same order on each day. Bottom, pie charts show substantial contribution of GrCs and L5 cells to both clusters.
(G) The correspondence between cluster membership and L5/GrC cell type was characterized via the normalized mutual information. Mutual information was generally close to zero, indicating that L5 cells and GrCs were recruited together into coherently evolving cell assemblies during learning. Boxes show median, 25/75th percentiles over 1,000 clustering instantiations.
See Figure S6 for further analyses and related data.

