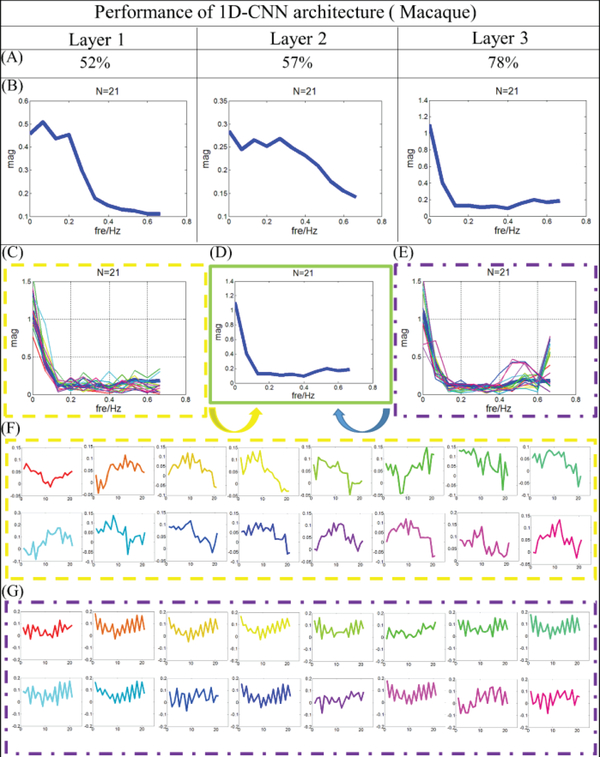
Fig 12.
Filter feature analysis for macaque monkey brain. (A) Classification performance from layer 1 to 3. (B) The distribution of frequency for filter features in average level from layer 1 to 3. (C) The distribution of frequency for features from gyral filters. The distribution of frequency for the last layer is provided using bold blue line. (D) Distribution of frequency for the last layer. (E) The distribution of frequency for features from sulcal filters. The distribution of frequency for the last layer is provided using bold blue line. (F) Original features which are corresponding to (C), and the correspondence is presented by color. (G) Original features which are corresponding to (E), and the correspondence is presented by color.

