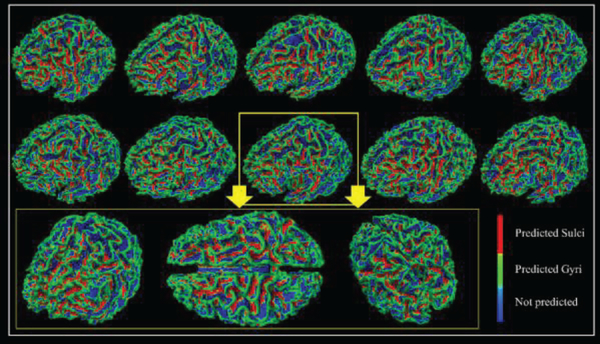
Fig 3.
The classification performance of 10 subjects in task EMOTION. Each vertex on the surface is given a predicted label. Green vertices are predicted as gyri, red vertices are predicted as sulci, and blues ones are vertices that not used. Zoom-in figures are used to show the performance of one case in 3 different directions.

