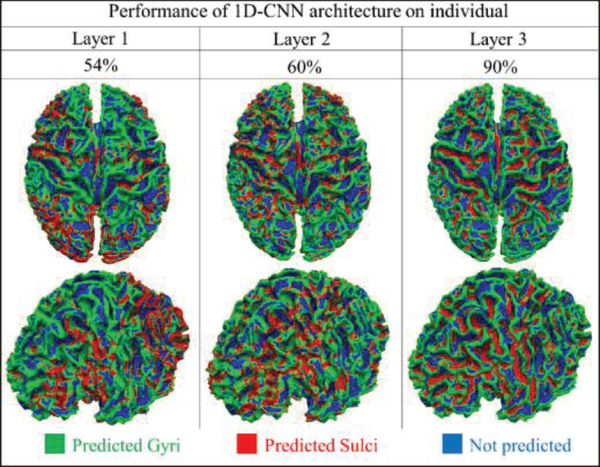
Fig 6.
The classification performance of 3 convolutional layers in task EMOTION at individual level (one subject from task EMOTION). Each vertex is given a predicted label. Spatial maps of 2 different view angles are used to show the classification performance of each layer. Green vertices are predicted as gyri, red vertices are predicted as sulci, and blues ones are vertices that are not used.

