Figure 2.
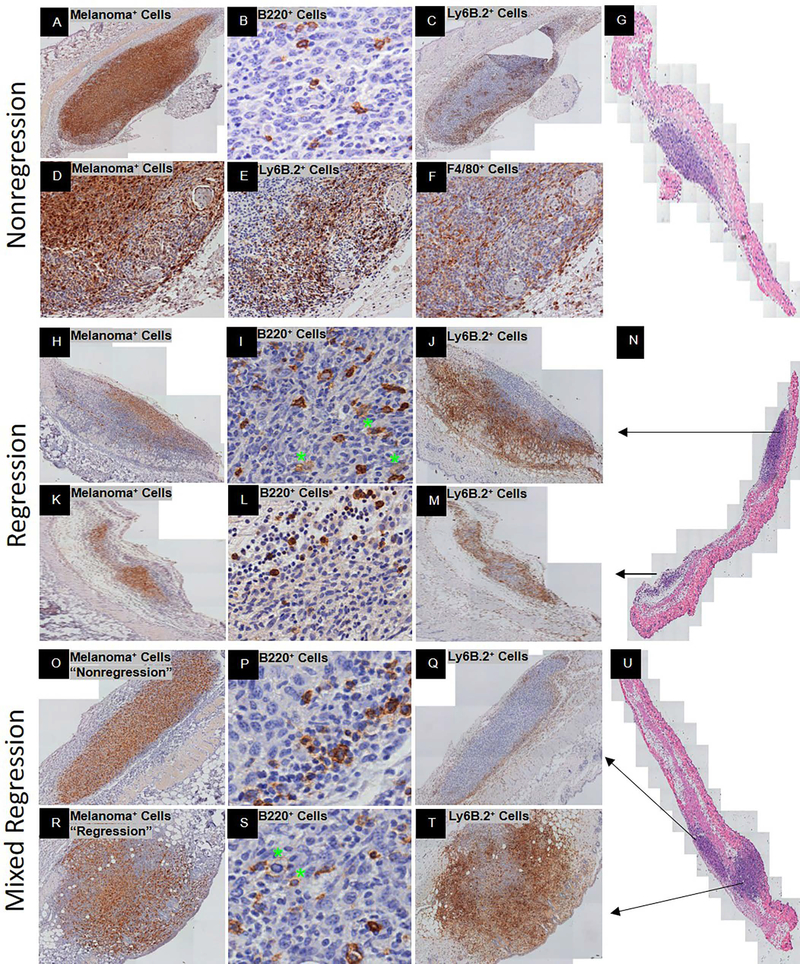
Spontaneous adaptive immune response at Day 9–10 post-YUMMER1.7 implantation in C57BL/6J mice. Three regression phenotypes were identified: exclusive nonregression (A-G), exclusive regression (H-N), and mixed regression (O-U). Representative histology is shown at low and/or high magnification. Exclusive nonregression phenotype includes (A) GFP+ melanoma cells (nucleus+cytoplasmic+), (B) B220+ B cells, and (C) Ly6B.2+ neutrophils. (D-F) Low magnification of GFP+ melanoma cells (nucleus+cytoplasmic+) with corresponding peri-tumor Ly6B.2+ neutrophils and F4/80+ macrophages, respectively. (G) H&E of exclusive nonregression biopsy. Exclusive regression phenotype includes (H, K) GFP+ melanoma cells (nucleus+cytoplasmic+), (I, L) B220+ B cells, (J, M) Ly6B.2+ neutrophils, and (N) H&E of exclusive regression biopsy. Mixed regression consists of an area with nonregression (O-Q) and an area with regression (R-T). Mixed regression phenotype includes (O, R) GFP+ melanoma cells (nucleus+cytoplasmic+), (P, S) B220+ B cells (green stars denote plasmablasts and/or plasma cells), and (Q, T) Ly6B.2+ neutrophils. (U) H&E of mixed regression biopsy. Black arrows depict the area of the biopsy specimen that the row represents.

