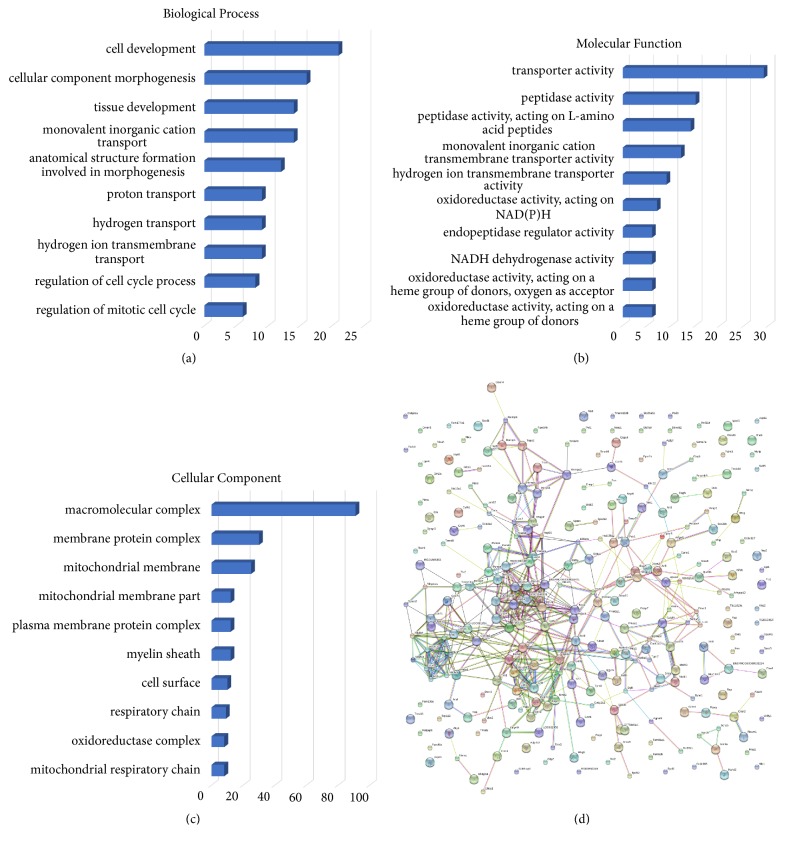
Figure 3.
EA changes hippocampus proteomics characters in depressed rats. (a)-(c) Bar charts of the GO annotation of different proteins comparing groups. Figures (a), (b), and (c) denote biological process, cellular component, and molecular function of differential expressed proteins between CUMS and control rats' hippocampus, respectively. Scale bar: number of proteins. (b) Protein-protein interactions identified comparing EA and CUMS groups. Network of EA/CUMS has significantly more interactions than expected in STRING analysis. Network nodes: proteins; edges: associations (stronger associations are represented by thicker lines).

