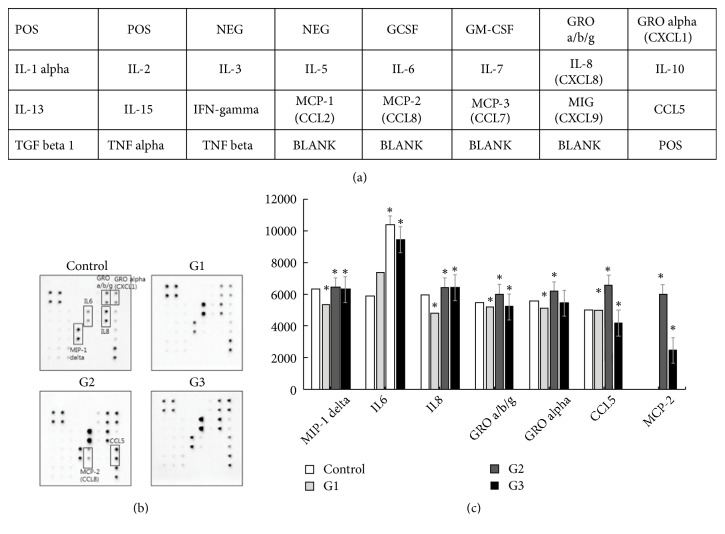
Figure 5.
Representative profile of the release of cytokines from hMSCs activated by microparticulated G. frondosa. (a) Template showing the location of antibodies for protein spotted onto the human cytokine antibody array kit. (b) Representative expression of various antibodies in the cell-free supernatants with or without G. frondosa treated. (c) Relative protein levels detected with the cytokine array. Values are means ± SD for three concentrations per sample. ∗p < 0.05 compared with the control group.

