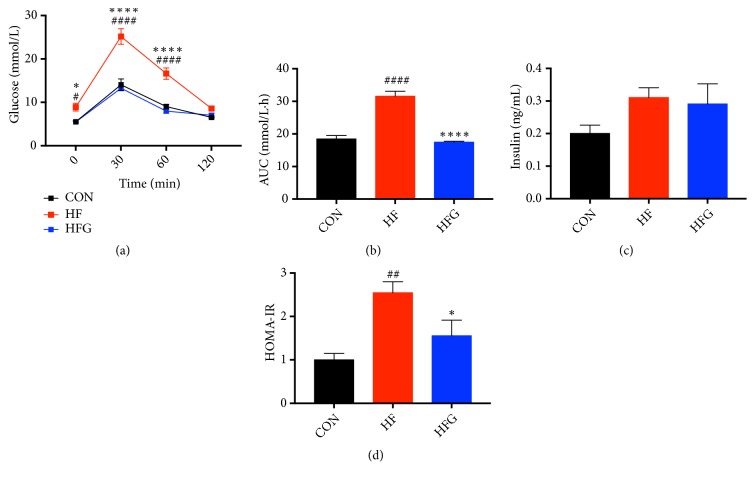
Figure 2.
Genistein improved the glucose tolerance and insulin sensitivity in mice fed HFG diet compared with those fed HF diet. (a) IPGTT; (b) AUC; (c) serum insulin levels; (d) HOMA-IR. IPGTT: intraperitoneal glucose tolerance test; AUC: area under the curve; HOMA-IR: the homeostasis model assessment of insulin resistance. CON: normal control diet; HF: high-fat diet without genistein; HFG: high-fat diet with genistein. Data are expressed as means ± S.E.M. (n=8/group). Mean values were significantly different between other groups and the CON group: #p<0.05; ##p<0.01; ###p<0.001; ####p<0.0001. Mean values were significantly different between HF group and the HFG group: ∗p<0.05, ∗∗p<0.01, ∗∗∗p<0.001, ∗∗∗∗p <0.0001.

