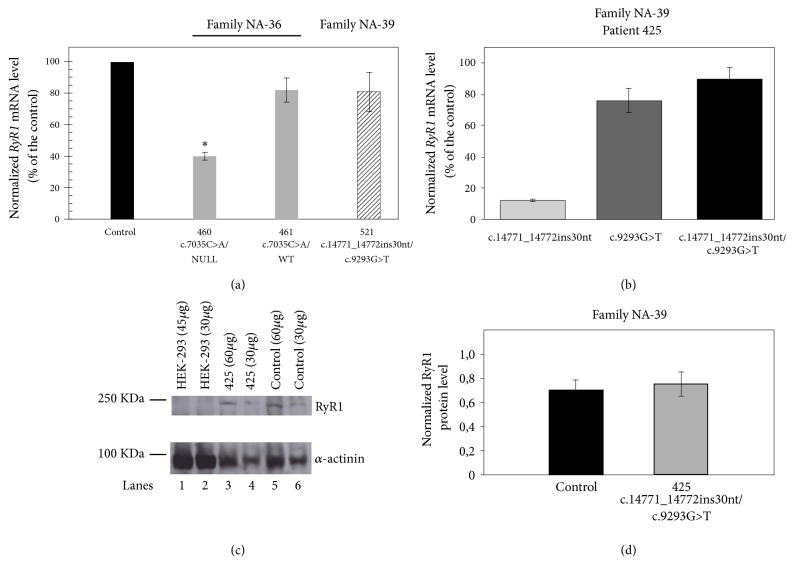
Figure 3.
Expression of RYR1 variant alleles. (a) Relative quantification of RYR1 mRNA isolated from immortalized B-lymphocytes of patients 460, 461 (Family NA-36), and 521 (Family NA-39. Real-time PCR was performed on cDNAs of patients and of a control. GAPDH was used as reference gene. The relative expression was calculated using the 2-ΔΔCt method. Data are presented as mean ± standard error of the mean (SEM). Statistical analysis was performed by one-way analysis of variance followed by Dunnett's test (∗p< 0.05). (b) To analyze the relative expression of the two variant alleles identified in family NA-39, the PCR products from cDNAs of patient 425 were analyzed by capillary gel electrophoresis, as described in Materials and Methods. RYR1 mRNA levels in the CCD patient 425 (normalized by β-actin mRNA levels) are expressed as percentages of the control. Each experiment was performed in triplicate. Data are presented as mean ± SEM. (c) and (d) RyR1 protein levels of patient 425 determined by semiquantitative Western blot. (c) Representative Western blot. Homogenates from HEK293 cells (lanes 1 and 2) as a control not expressing RyR1, from lymphoblastoid cells of patient 425 (lanes 3 and 4), and from the control (lanes 5 and 6) were loaded on an SDS-polyacrylamide gel and processed as described in Materials and Methods. (d) The RyR1 protein levels in the control and in patient 425 were normalized by α-actinin levels. Data are presented as mean of three experiments. Error bars show the SEM. Statistical analysis was performed by the two-tailed Student's t-test (p=0.617).

