Figure 5.

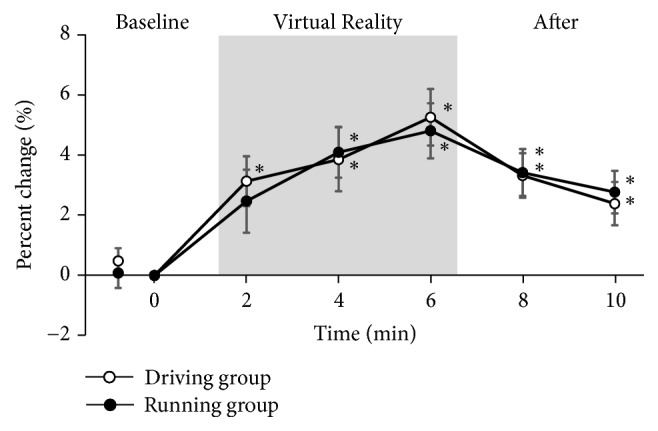
Percent change for the HPT of the hand. HPT, heat pain thresholds. Values are normalized to baseline values and expressed as mean ± SEM. ∗: p < 0.05 vs. baseline. Significance level is less than 5%.

Percent change for the HPT of the hand. HPT, heat pain thresholds. Values are normalized to baseline values and expressed as mean ± SEM. ∗: p < 0.05 vs. baseline. Significance level is less than 5%.