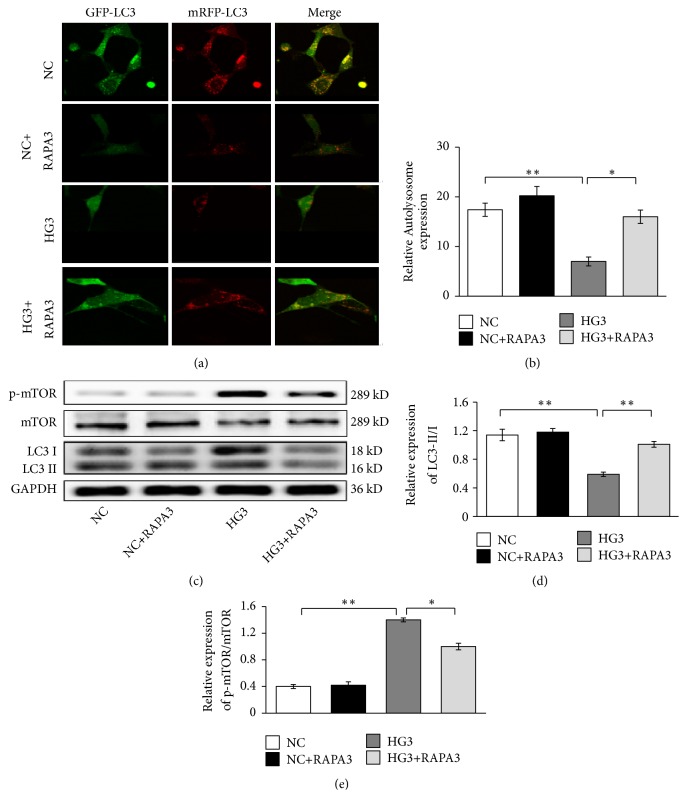
Figure 2.
Effects of 30 mmol/L high glucose and rapamycin on mTOR/autophagy signaling in renal mesangial cells. (a) Autolysosome detected by confocal laser scanning microscope. (b) Quantitative analyses of number of autolysosomes. (c) mTOR, p-mTOR, and LC3-II/I detected by western blot. (d) The corresponding relative gray value statistics graph of LC3B. (e) The corresponding relative gray value statistics graph of p-mTOR/mTOR. ∗P < 0.05 and ∗∗P < 0.01.

