
Figure 1. Comparison of cell viability on (A) CCD841CoN(B) NHDF (C) HCT116 (D)HeLa (E) HepG2 (F)MCF7 (G) SW-620 treated for 24 h with wtHALT-1 and mHALT-1.
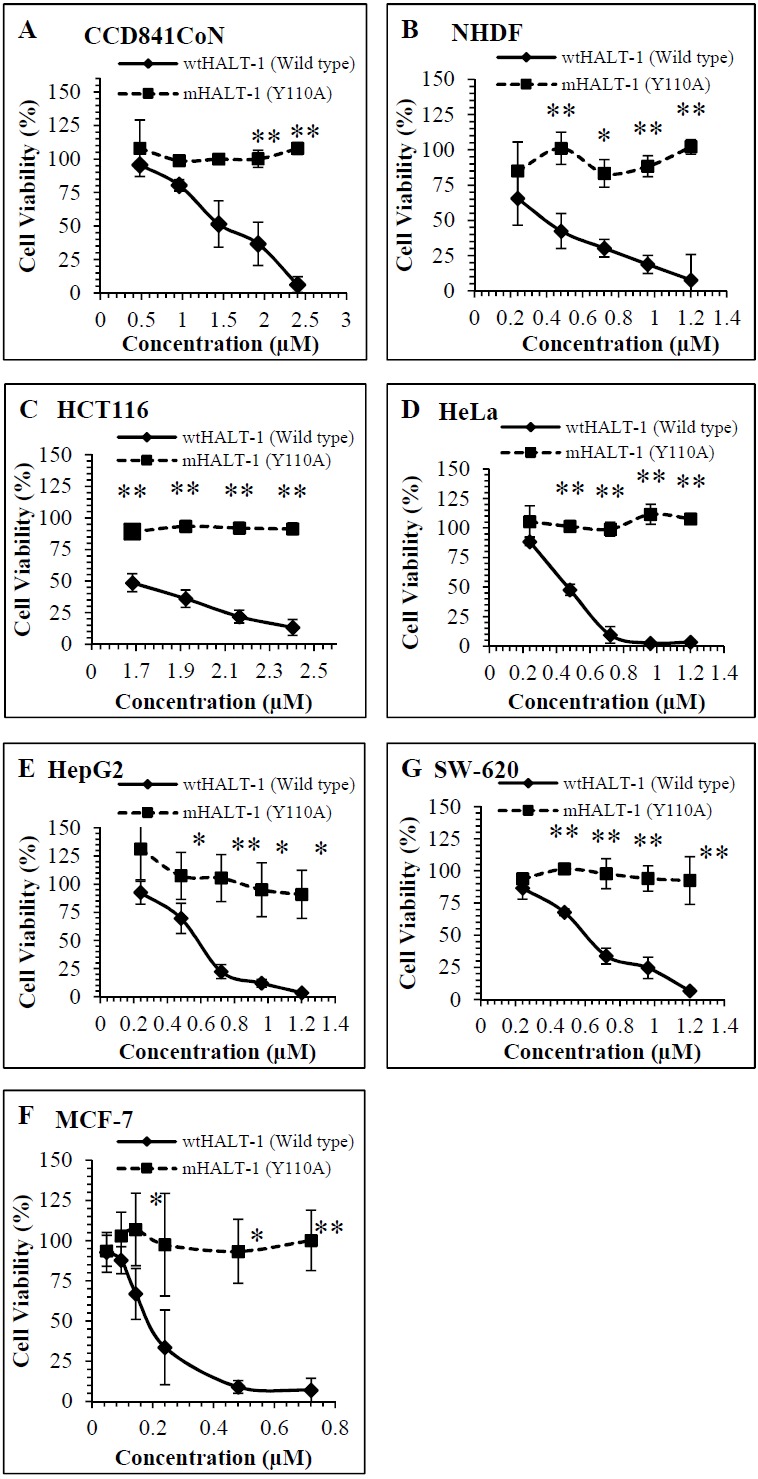
Data are represented as means ± SD of three samples from three independent experiments, where (*) indicates significant difference levels as *p < 0.05, and **p < 0.01.