
Figure 2. Annexin V/FITC-PI flow cytometry analysis of various cancer cells (1 × 10⁶ cells/mL) treated with negative control, wtHALT-1,mHALT-1 and camptothecin for 24 h.
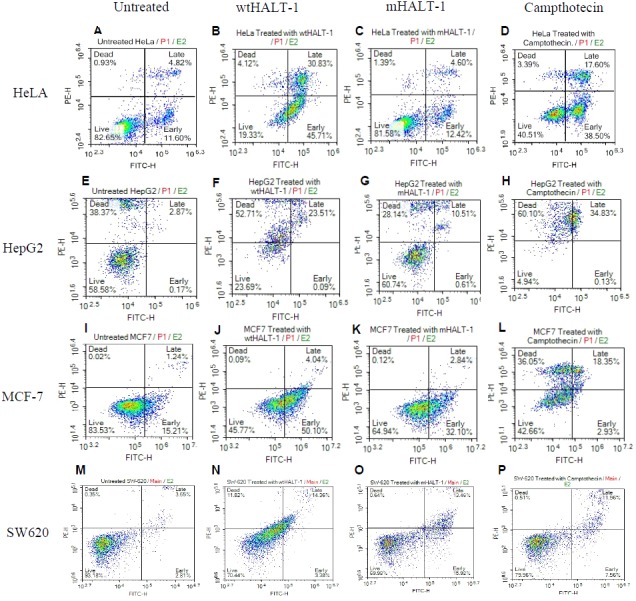
Cells were dual stained with Annexin V-FITC and propidium iodide, and the dot plot of HeLa, HepG2, MCF-7 and SW-620 with different treatments were shown. Each set of data shown are a representative plot of three independent experiments, while percentages are the mean value of three independent experiments.