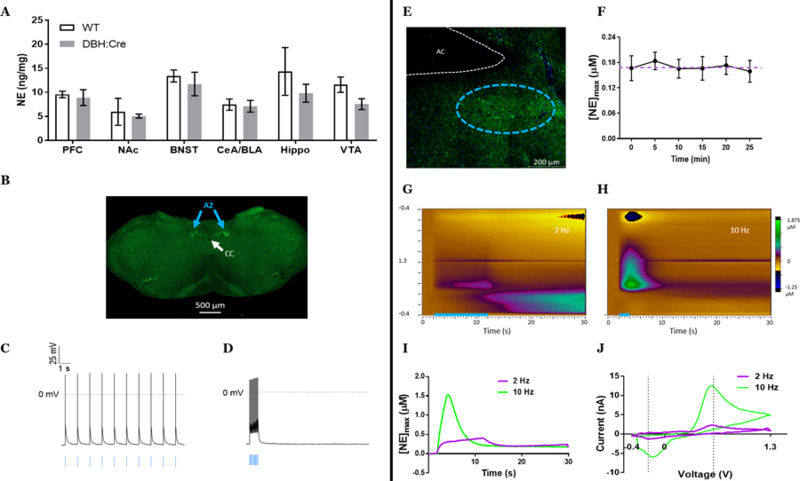
Figure 1.

DBH::Cre(+/−)::Ai32(+/+) mice act as a reliable model to study noradrenergic function. A) Transgene expression does not alter norepinephrine tissue content across multiple brain regions; p > 0.05.B) Cell body expression of GFP labeling noradrenergic neurons in the A2 cell group of the medullary nucleus of the solitary tract C,D) Patch clamp electrophysiology shows that GFP+ neurons in A2 fire action potentials in response to optogenetic cell body stimulation (blue bars) at both 1 Hz (C) and 15 Hz (D) frequencies. E) Terminal projections (green = GFP) in fusiform subnucleus (outlined in cyan dashes) of the ventral bed nucleus of the stria terminalis. F) 10 Hz, 20 pulse optogenetic stimulation of the vBNST induces consistent concentrations of norepinephrine release over multiple stimulations. Mean±SEM; n = 4 recording sites from 4 mice; p > 0.05. G) Color plot representing NE release following 2 Hz, 20 pulses of optogenetic stimulation. H) Color plot representing NE release following 10 Hz, 20 pulses of optogenetic stimulation. I) Representative norepinephrine concentration over time following either 2 Hz, 20 pulses pulse (lilac) or 10 Hz, 20 pulses (lime). Optogenetic stimulation occurred at 2 s. J) Representative cyclic voltammograms of either 2 Hz, 20 pulses pulse (lilac) or 10 Hz, 20 pulses (lime).
