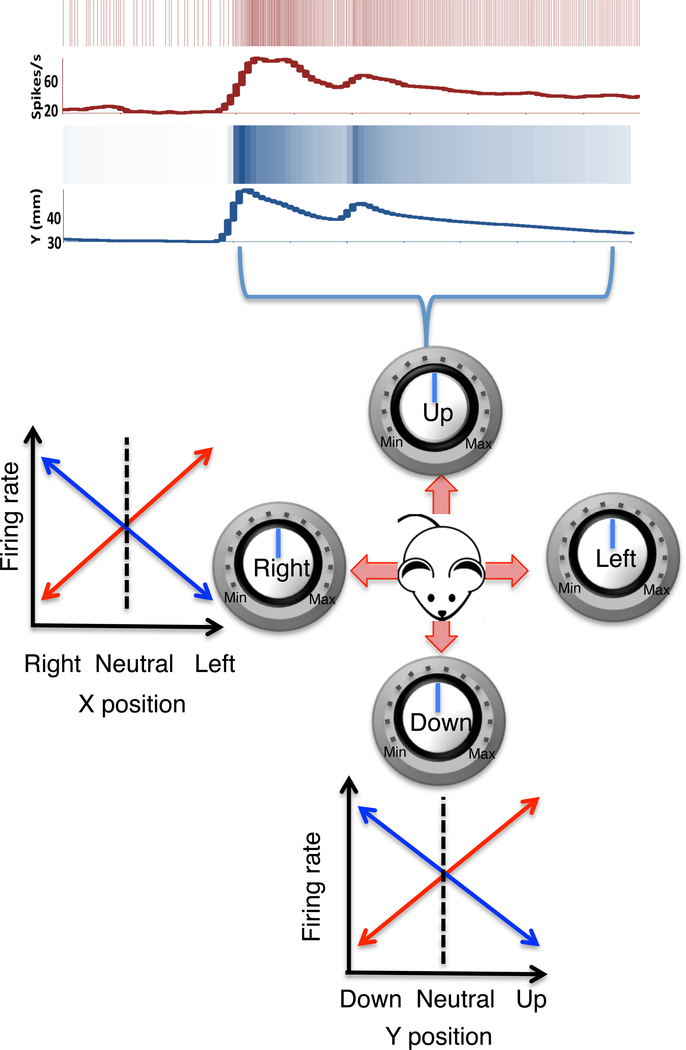
Figure 3. BG output reflect x and y coordinates of head position.
The GABAergic output neurons of the SNr map instantaneous position coordinates. Top raster plots show the relationship between a SNr neuron and the y position coordinates. Below are schematic illustrations of four major classes of neurons, based on the relationship between their firing rates and position coordinates. For example, for horizontal motion, two types of neurons were found: 1) one type (red) increases firing with leftward movement and decreases firing with rightward movement; 2) a second type (blue) increases firing with rightward movement and decreases firing with leftward movement. The same is true of the vertical component of the movement along the y-axis. A change in firing rate therefore reflects a position change in a specific direction.

