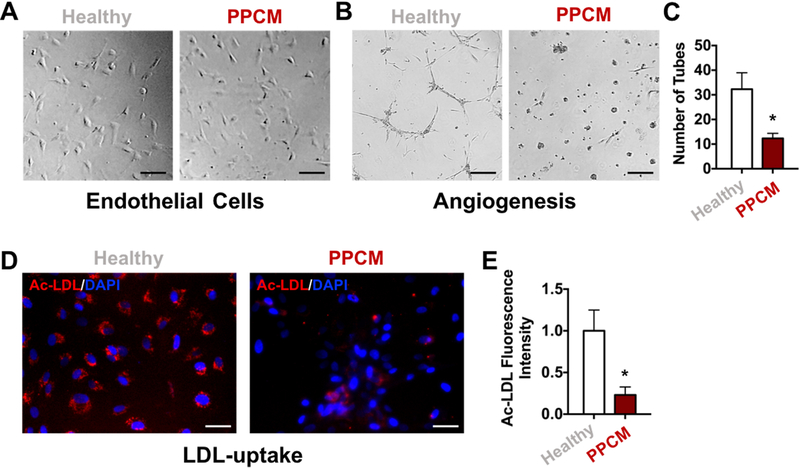
Figure 3. Functional characteristics of primary endothelial cells from PPCM heart.
(A) Representative images of primary endothelial cells isolated from healthy and PPCM hearts. (B) Representative images of capillary-like networks formed by primary ECs showing impaired tube formation by PPCM ECs compared to healthy controls. (C) Bar graph showing quantification of the number of tubes formed by the primary ECs. (D) Representative fluorescent images of Ac-LDL uptake by primary ECs showing reduced capacity to incorporate Ac-LDL by PPCM ECs compared to healthy controls. (E) Bar graph showing quantification of Ac-LDL fluorescence intensity in primary ECs. All data represented as mean ± SEM, n=3, *p<0.05. Statistical analyses were done using standard Student t test and Mann-Whitney nonparametric test.

