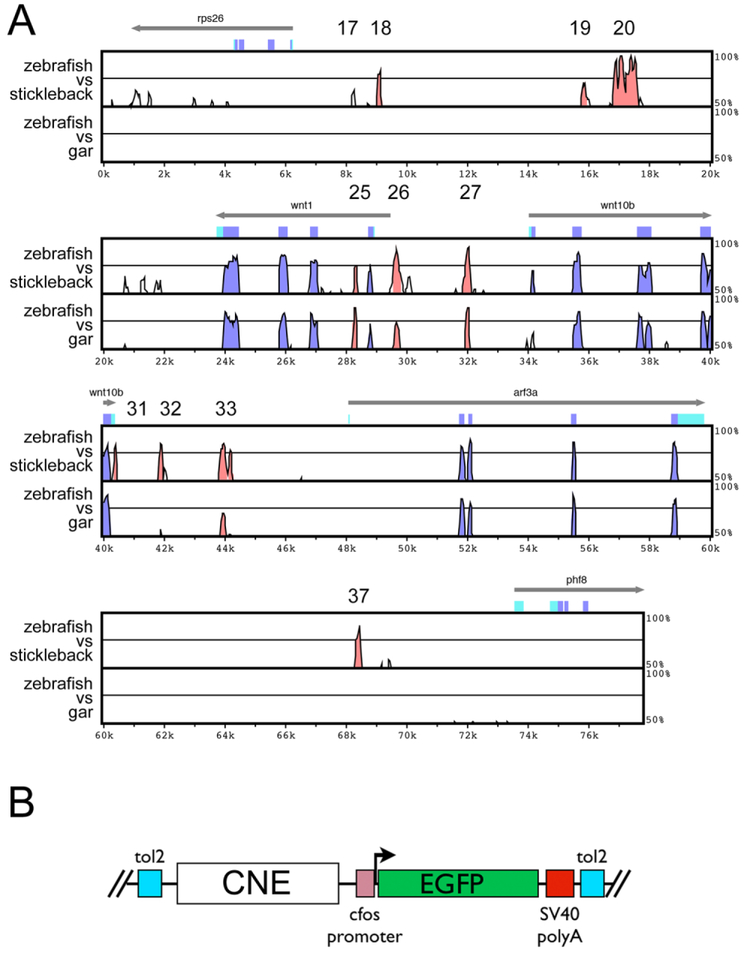
Figure 2. Analysis of sequence conservation in the wnt1-arf3 genomic interval.
(A) Vista plot comparison of zebrafish to stickleback (top bracket) and zebrafish to spotted gar (bottom bracket). Conserved noncoding elements are represented by red peaks. Numbering is according to vista browser output. The absence of element 20 in the zebrafish-gar comparison is attributable to an incomplete gar contig; element 20 is found on a separate contig. (B) Schematic diagram of the reporter construct used to evaluate transcriptional activity of CNEs. Tol2 elements facilitate transposition via the Tol2 system. Constructs include the cfos minimal promoter.

