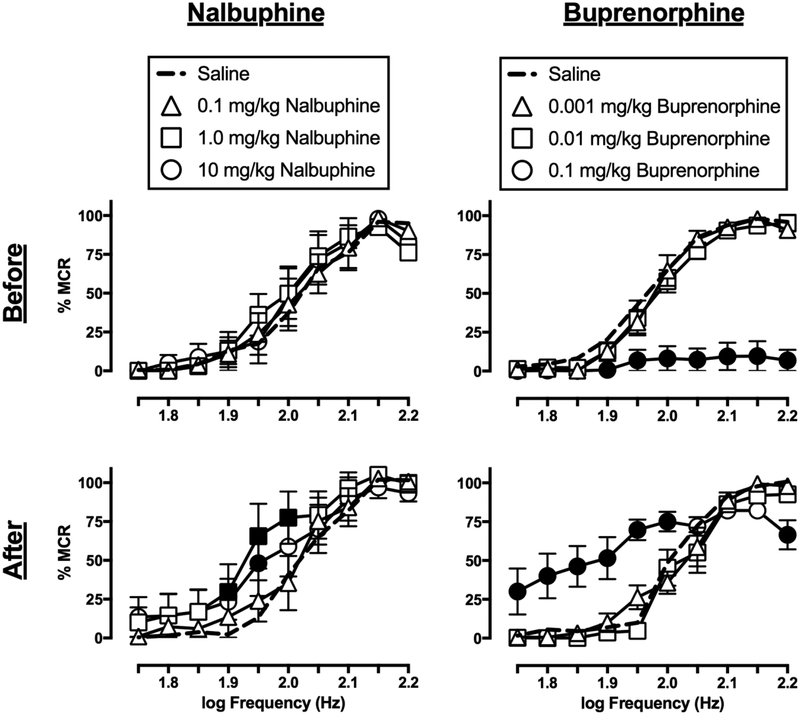
Figure 2.
Effects of nalbuphine (left panels) and buprenorphine (right panels) on ICSS frequency-rate curves in rats before (top panels) and after (bottom panels) seven-day treatment with 10 mg/kg/day nalbuphine or 0.032 mg/kg/day buprenorphine, respectively. Abscissae: electrical brain stimulation frequency in Hertz (Hz, log scale). Ordinates: ICSS reinforcement rate expressed as a percentage of the maximum control rate (% MCR). Filled symbols indicate statistical significance (p<0.05) as compared to saline. All points show mean ± S.E.M. for n=6 rats.

