
Figure 3.
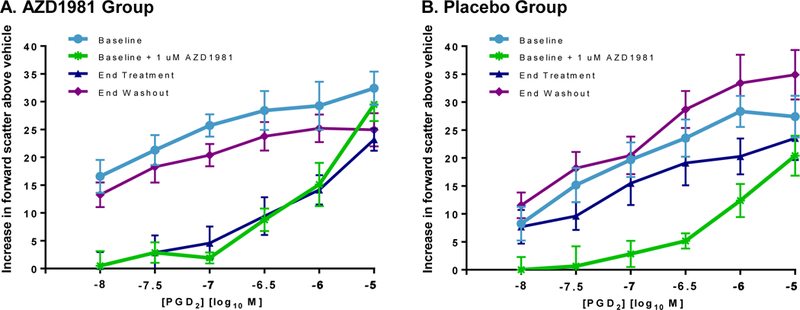
Effect of AZD1981 therapy on ex vivo eosinophil shape change is shown as net change (baseline value - no PGD2) for subjects at randomization, the end of treatment, and the end of washout. Values are shown as mean ± SEM. *P < .05.
Official websites use .gov
A
.gov website belongs to an official
government organization in the United States.
Secure .gov websites use HTTPS
A lock (
) or https:// means you've safely
connected to the .gov website. Share sensitive
information only on official, secure websites.
Effect of AZD1981 therapy on ex vivo eosinophil shape change is shown as net change (baseline value - no PGD2) for subjects at randomization, the end of treatment, and the end of washout. Values are shown as mean ± SEM. *P < .05.