
Figure 5.
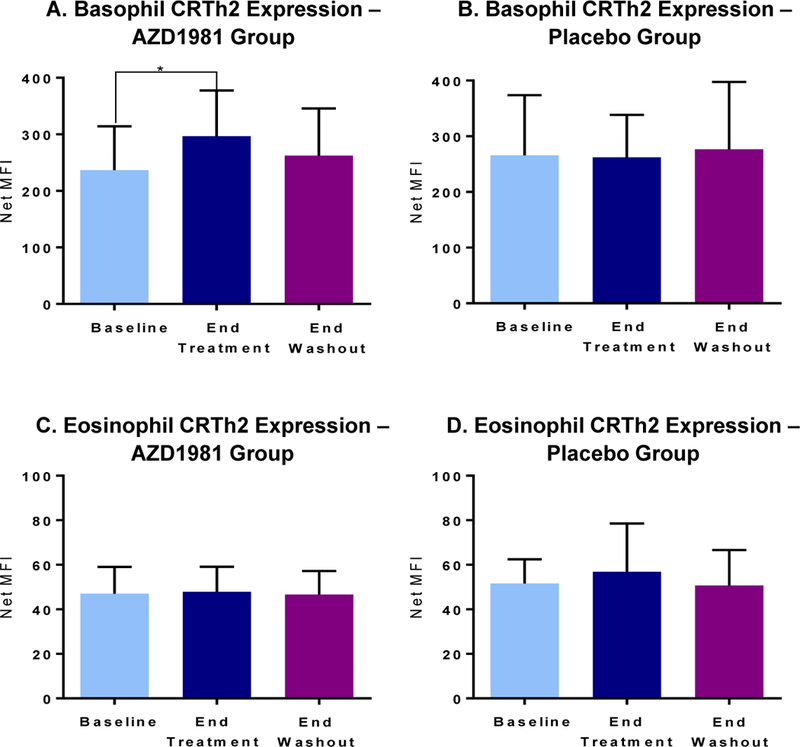
Expression of CRTh2 on blood basophils and eosinophils is shown at baseline, the end of treatment, and the end of washout. A,B. Upper panels: basophil CRTh2 levels in active (left) and placebo recipients. C,D. Lower panels: eosinophil CRTh2 levels in active (left) and placebo recipients. Values are shown as mean ± SEM. *P < .05.