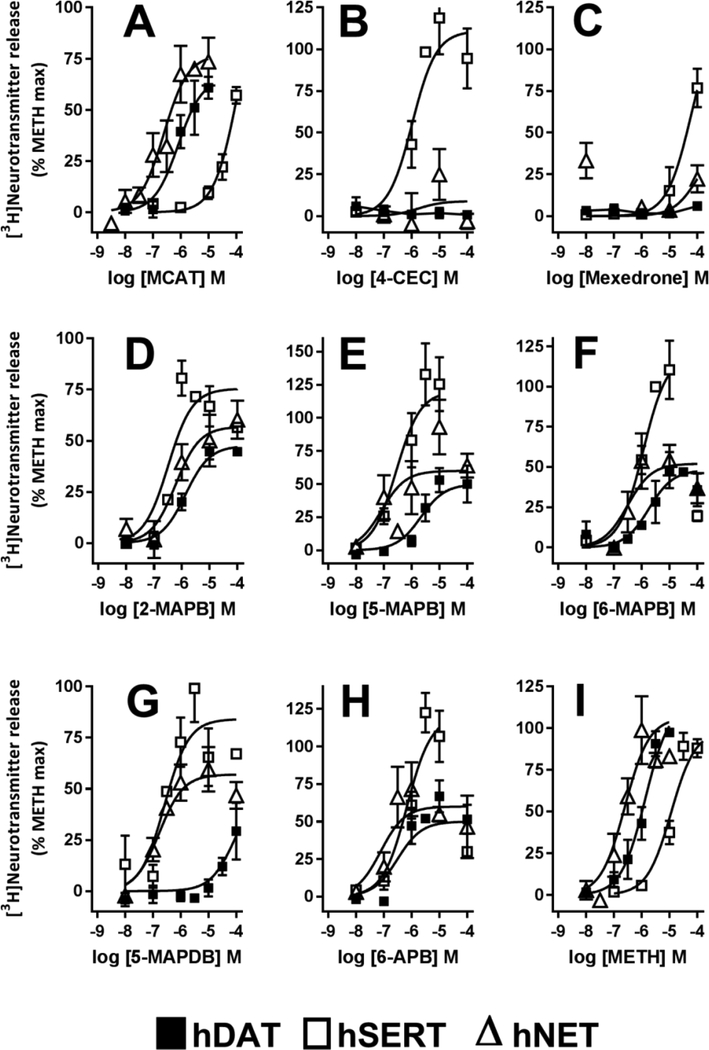
Figure 3.
Concentration-response curves for [3H]neurotransmitter release by METH, MCAT, and 7 substituted cathinones and benzofurans. (A) MCAT, (B) 4-CEC, (C) Mexedrone, (D) 2-MAPB, (E) 5-MAPB, (F) 6-MAPB, (G) 5-MAPDB, (H) 6-APB and (I) METH. The AUC for each drug concentration was normalized to the maximal METH effect. hDAT: [3H]DA release. hSERT: [3H]5-HT release. hNET: [3H]NE release. Data are the mean and S.E.M. of three or more experiments, except when a drug had no releasing efficacy, when data are the mean and range of two experiments.

