FIGURE 8.

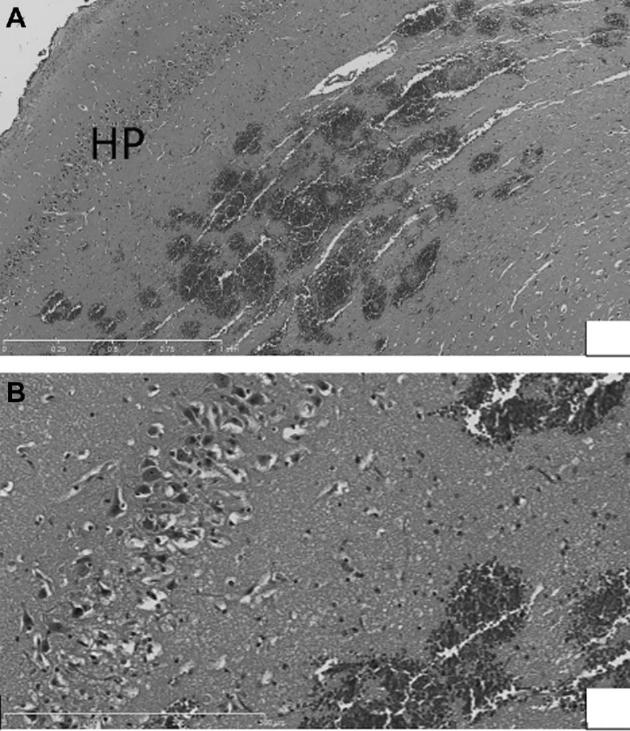
A, Low power view (5×) of petechial hemorrhage in/near hippocampus. B, Higher power view (20×) of petechial hemorrhage in/near hippocampus, with edema and pyknotic and eosinophilic neurons visible (within rectangles).

A, Low power view (5×) of petechial hemorrhage in/near hippocampus. B, Higher power view (20×) of petechial hemorrhage in/near hippocampus, with edema and pyknotic and eosinophilic neurons visible (within rectangles).