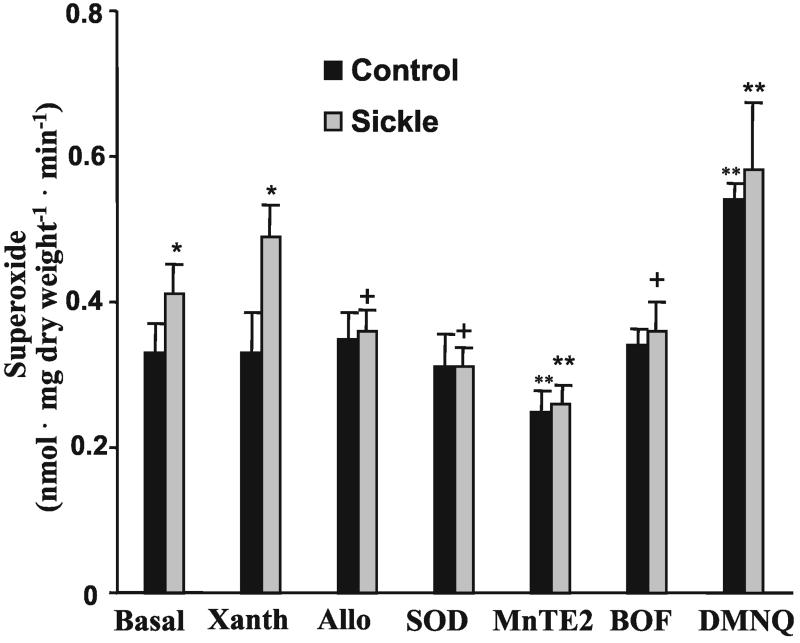
Figure 3.
Superoxide production by C57BL/6J control and sickle cell mouse vessels. Values represent mean ± SD (n = 4). Statistical analysis was by two-way ANOVA with the Duncan's post hoc test. *, P < 0.05 compared with control. +, P < 0.05 compared with xanthine-treated sickle cell vessels. **, P < 0.05 compared with control and all treated vessel groups.

