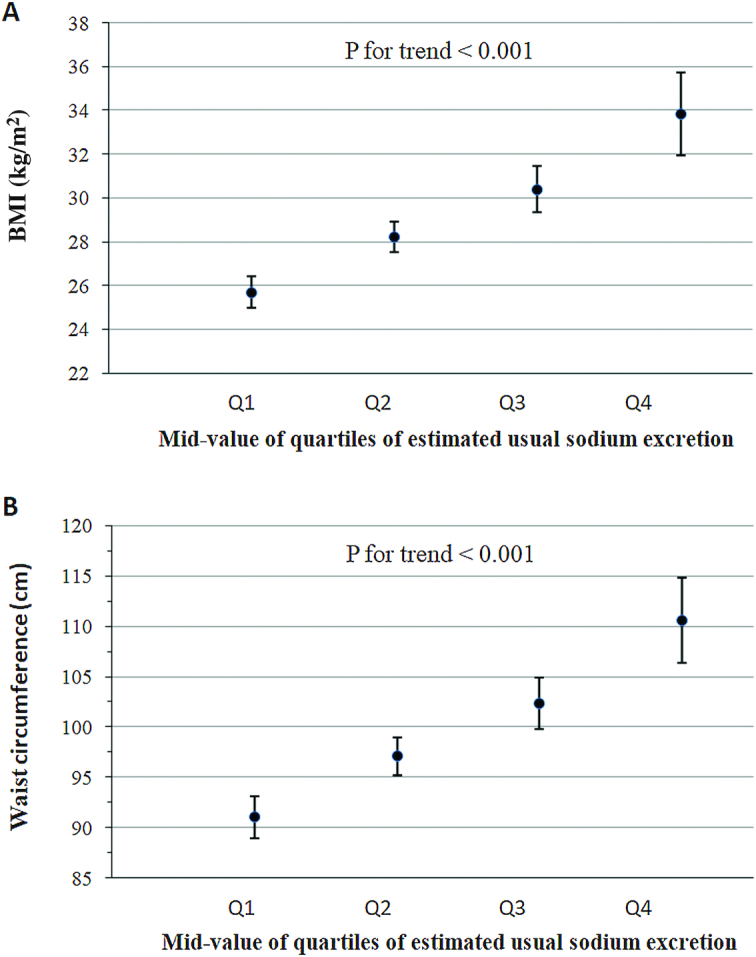
FIGURE 1.

Adjusted mean BMI (A) and waist circumference (B) by midvalue of the quartile of the estimated usual 24-h sodium excretion: NHANES 2014. Adjusted variables were age, sex, race–Hispanic origin, physical activity, alcohol consumption, smoking status, educational attainment, and usual total energy intake. The midpoint values for usual sodium excretion in each quartile are as follows: quartile 1, 2554 mg/d; quartile 2, 3192 mg/d; quartile 3, 3775 mg/d; quartile 4, 4770 mg/d. P values indicate tests for trend from the survey-adjusted regression models. Q, quartile.
