FIGURE.
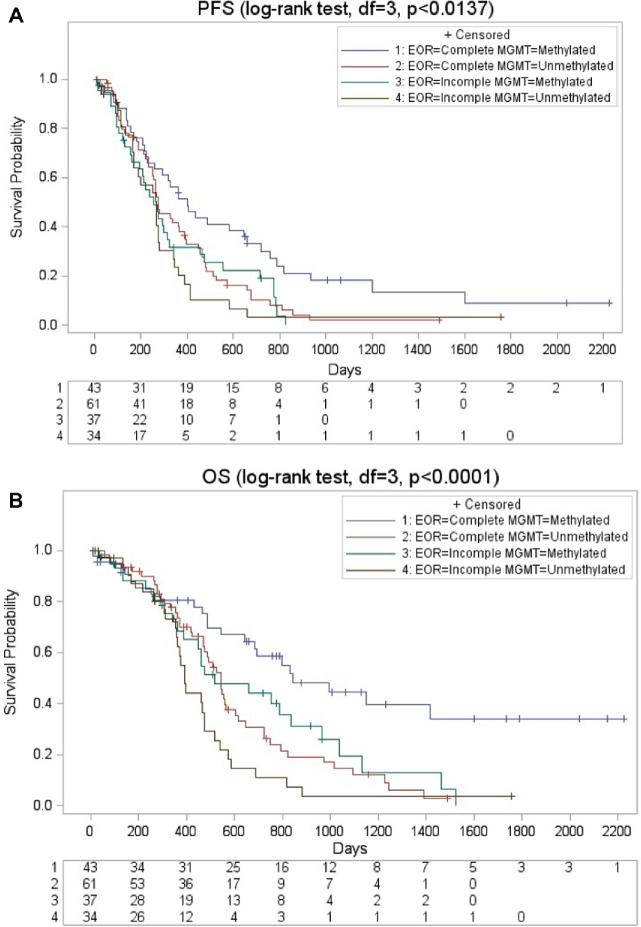
Kaplan–Meier curves for survival. A, Kaplan–Meier curves illustrating progression-free survival stratified between MGMT promoter methylation status and EOR. B, Kaplan–Meier curves illustrating overall survival stratified between MGMT promoter methylation status and EOR. EOR = Extent of resection; MGMT = O6-methylguanine-DNA methyltransferase.

