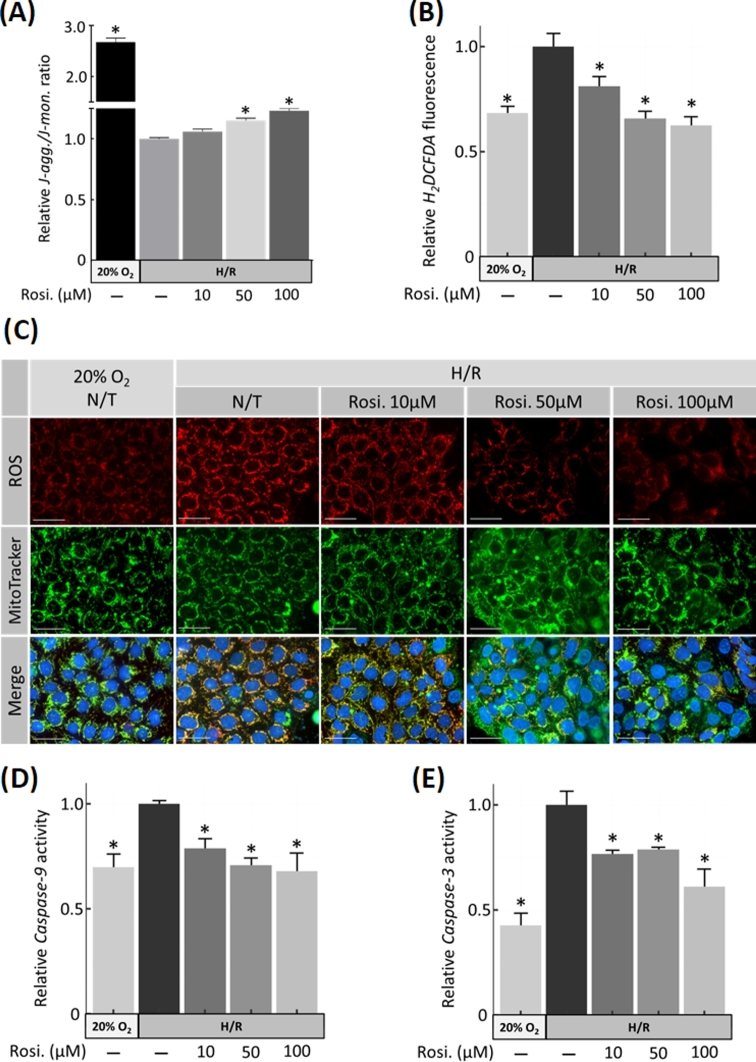
Figure 4.
Mitochondrial apoptotic pathway in H/R-injured JEG-3 cells and treatment with rosiglitazone. (A) Mitochondrial membrane potential (ΔΨm) was assessed as the J-aggregate/J-monomer ratio using JC-10 assay. (B) Quantification of ROS in JEG-3 cells using 2’,7’–dichlorofluorescin diacetate (DCFDA) showed that ROS production due to H/R decreased in response to rosiglitazone, as indicated by fluorescent dye intensity changes in C. Mitotracker green was used as mitochondrial marker. (D) Caspase 9 and (E) caspase 3 activities were assessed using fluorogenic substrates. N = 3; * P < 0.05 vs N/T control, N/T = no-treatment, Rosi. = Rosiglitazone, scale bar = 100 μm, bars present mean ± SEM.

