Figure 1.
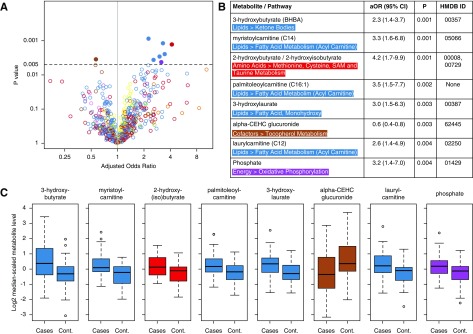
A metabolomic approach identifies potential metabolites associated with cardiac death in the Hemodialysis (HEMO) study. (A) Volcano plot and table depicting odds ratios and confidence intervals of the associations between individual metabolites (m=777) and cardiac death at 1 year in the HEMO Study (n=94). Each open circle represents a single metabolite plotted by its odds ratio (x axis) and P value (y axis). The y-axis horizontal line at 0.005 represents the P value threshold used in the primary analysis. Closed circles represent metabolites with potential associations. (B) Cardiac death–related metabolites are presented with superpathways, subpathways, adjusted odds ratios (aORs) with 95% confidence intervals (95% CIs), P values for association on logistic regression (Ps), and Human Metabolome Database (HMDB) identification. (C) Tukey boxplots of log2-transformed and median-scaled metabolite levels of each of the cardiac death–related metabolites in patients and controls. Boxes indicate 25th, 50th, and 75th percentiles of data, with whiskers indicating values within 1.5 times the interquartile range above and below the median. Metabolites are color coded by pathway, whereby red denotes amino acids, green denotes carbohydrates, brown denotes cofactors, purple denotes energy metabolites, blue denotes lipids, orange denotes nucleotides, pink denotes peptides, and yellow denotes nondrug xenobiotics. The HEMO study was a patient-control design. Logistic regression models were adjusted for age, sex, race, diabetes, cardiovascular disease, albumin, Index of Coexistent Disease score, duration of prior dialysis, and systolic BP. cont, control.

