
Figure 2.
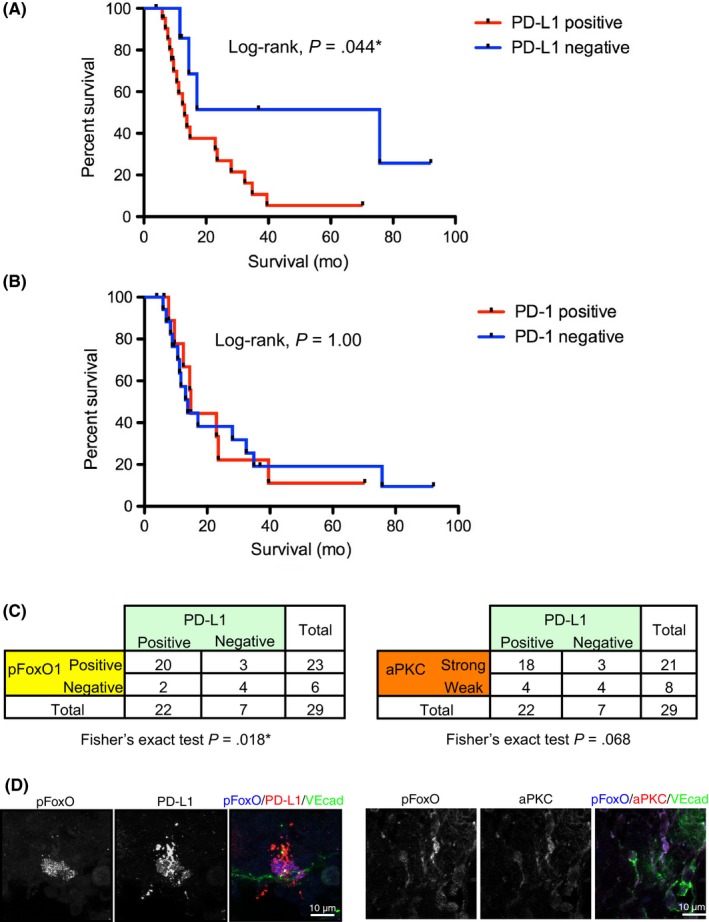
Correlation of programmed cell death ligand 1 (PD‐L1) expression with poor prognosis of patients, the presence of pSer218 Forkhead box protein O1 (FoxO1), and atypical protein kinase C lambda/iota (aPKCλ) expression. A, Kaplan‐Meier curve of patients with PD‐L1+/PD‐L1− tumors revealed the poor prognosis of patients with PD‐L1+ tumors (log‐rank, *P < .05). B, Kaplan‐Meier curve of the patients with PD‐1+/PD‐1− tumors failed to show any significant difference between these 2 groups (log‐rank, P = 1.00). C, PD‐L1 expression strongly correlated with pSer218 FoxO1 expression on cutaneous angiosarcoma tissue, analyzed by Fisher's exact test using 2 × 2 contingency table (P = .018*). PD‐L1 expression related to strong aPKCλ expression with marginal statistical difference analyzed by Fisher's exact test (P = 0.068). D, Representative confocal images of PD‐L1 (red)/pFoxO (blue) or aPKC (red)/pFoxO (blue) with vascular endothelial‐cadherin (VEcad; green)