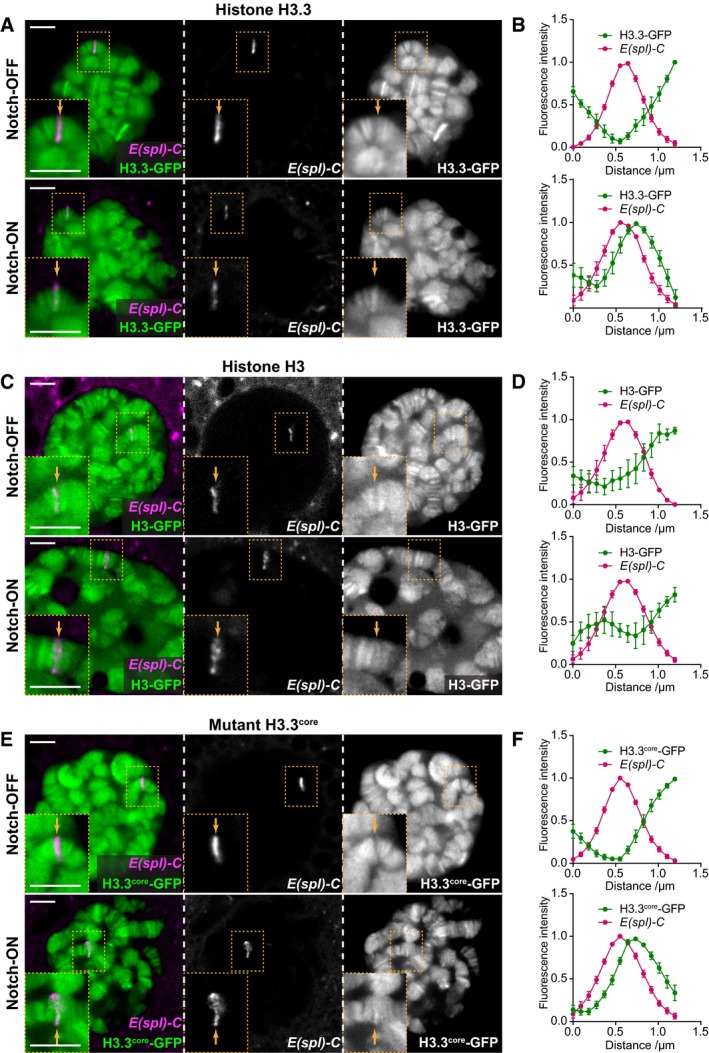
(A, C, E) Live imaging of histone‐GFP (green) and ParB‐mCherry (magenta) expressed in larval salivary gland nuclei using 1151‐Gal4. H3.3‐GFP levels are increased at the
E(spl)‐C in the presence of constitutively active Notch, N
ΔECD (Notch‐ON), compared to control Notch‐OFF nuclei expressing LacZ (A). The same is seen with H3.3
core‐GFP (E), but there is little change in H3‐GFP between Notch‐OFF and Notch‐ON nuclei (C). ParB‐mCherry binds to its cognate
int DNA sequence inserted within the
E(spl)‐C
8,
64. Yellow dotted box contains
E(spl)‐C, and yellow arrow indicates position of
E(spl)‐C on chromosome. Scale bars (white) = 5 μm. (B, D, F) Quantifications of relative fluorescence intensity of histone‐GFP and ParB‐mCherry across the
E(spl)‐C in Notch‐OFF (upper) and Notch‐ON (lower) conditions. Mean ± SEM;
n
nuclei = 7, 6, 5, 8, 9, and 11 and
n
glands = 5, 5, 5, 5, 5, and 4 where each gland represents a biological replicate (from top to bottom).

