Figure 1.

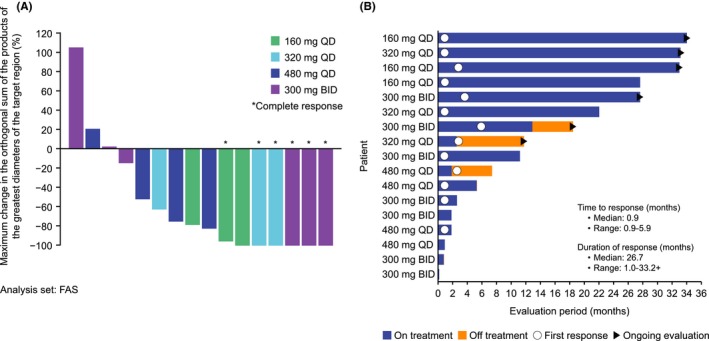
Maximum change in the orthogonal sum of the products of the greatest diameters of the target region (A) and the time to response and duration of response (B). +, censor; FAS, full analysis set

Maximum change in the orthogonal sum of the products of the greatest diameters of the target region (A) and the time to response and duration of response (B). +, censor; FAS, full analysis set