Figure 2.

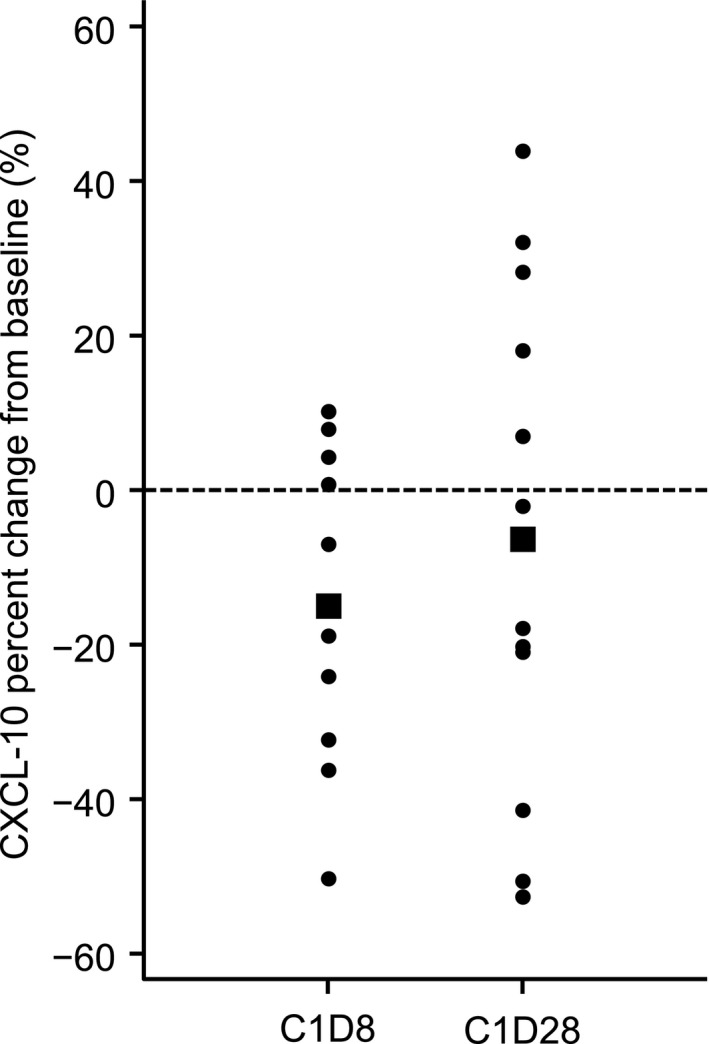
CXCL‐10 percent change from baseline in all 13 responders (partial response or more) on C1D8 and C1D28. Bold squares represent the average value

CXCL‐10 percent change from baseline in all 13 responders (partial response or more) on C1D8 and C1D28. Bold squares represent the average value