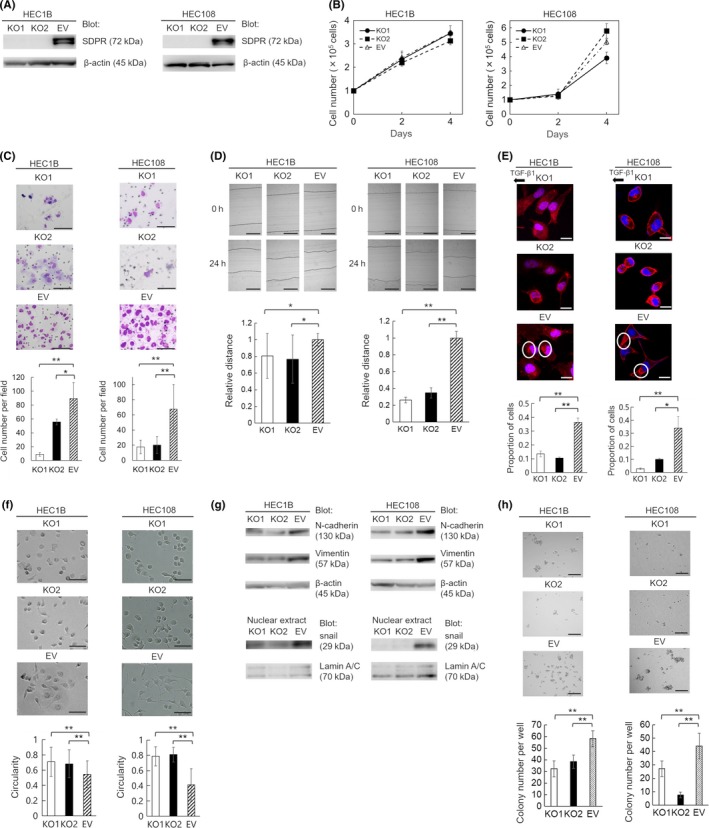
Figure 3.

Generation of serum deprivation‐response protein (SDPR)‐knockout HEC‐1B and HEC‐108 cells using the CRISPR/Cas9 system and functional analysis of SDPR. A, Confirmation of loss of SDPR expression in SDPR‐knockout cells (KO1 and KO2) by immunoblotting. Equal protein loading was confirmed by quantifying β‐actin (input control). EV, control cells. B, Cell proliferation on days 2 and 4. C, Matrigel invasion assay. Representative images of invading KO1, KO2, and EV cells are shown. Invasive cells were counted in 5 random fields per well. D, Wound‐healing assay. KO1, KO2, and EV cell layers were wounded with a pipette tip, and migration toward the wounded area was monitored. The distance of migration was calculated by subtracting the width of the wound at 24 h from that at 0 h. The distance of migration of EV cells is expressed as 1. The relative migration distance of KO1 and KO2 cells is presented as the ratio to that of EV cells. E, Chemotaxis assay. Representative images of KO1, KO2, and EV cells; proportion of cells in which F‐actin aggregated in the direction of transforming growth factor‐β1 (TGF‐β1) in 10 random fields. F, Shapes of KO1, KO2, and EV cells. G, Immunoblotting of N‐cadherin and vimentin in the cell lysate and snail in the nuclear extracts from KO1, KO2, and EV cells. Equal protein loading was confirmed by quantifying β‐actin in cell lysates and lamin A/C in nuclear extracts. H, Colony formation assay. Representative images of colonies of KO1, KO2, and EV cells. Colonies were counted in 5 random fields per well. Data are representative of 3 independent experiments and are shown as means ± SE (B–F, H). Scale bar = 100 μm (C), 200 μm (D), 20 μm (E), 100 μm (F), and 1 mm (H). Student's t test: *P < .05, **P < .01
