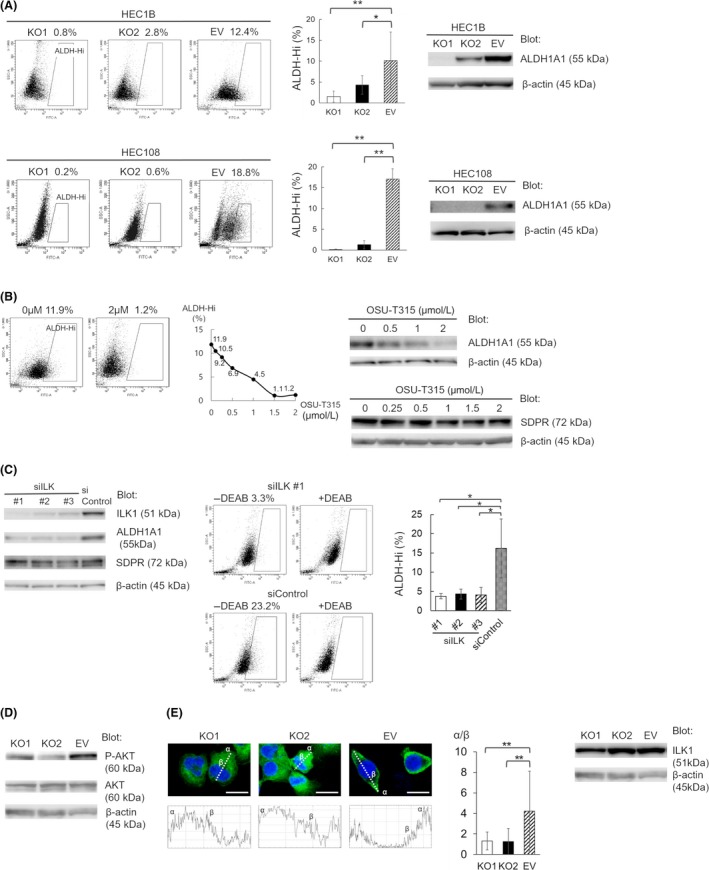
Figure 4.

Serum deprivation‐response protein (SDPR) regulates aldehyde dehydrogenase 1 (ALDH1) through integrin‐linked kinase (ILK) signaling. A, Proportion of ALDH‐hi cells according to Aldefluor staining (left and middle) and the ALDH1A1 protein level (right) in SDPR‐knockout KO1, KO2, and empty vector (EV) HEC‐1B and HEC‐108 cells. Equal protein loading was confirmed by quantifying β‐actin (input control). B, Effect of OSU‐T315 on the proportion of ALDH‐hi cells (left and middle) and the ALDH1A1 and SDPR protein level in EV HEC‐108 cells (right). Equal protein loading was confirmed by quantifying β‐actin (input control). C, Conformation of ILK knockdown in siILK #1, #2, and #3 EV HEC‐108 cells and effect of ILK knockdown on the ALDH1A1 and SDPR protein level (left). Equal protein loading was confirmed by quantifying β‐actin (input control). Proportion of ALDH‐hi cells in siILK #1, #2, #3, and siControl cells according to Aldefluor staining (middle and right). Dot‐blot of Aldefluor assay without inhibitor (left panels), and that with inhibitor (right panels). D, Immunoblotting of AKT and phospho‐AKT protein levels in KO1, KO2, and EV HEC‐108 cell lysates. Equal protein loading was confirmed by quantifying β‐actin (input control). E, Representative images of KO1, KO2, and EV HEC‐108 cells in a chamber slide. Cells were fixed and stained with an anti‐ILK1 Ab (left 3 pictures). Scale bar = 20 μm. The plot profile along the lines passing through the center of the cell (left 3 graphs). The relative quotient was defined as the ratio of the pixel intensity of the cell cortex (α) to that of the perinuclear region (β) (middle). ILK1 protein levels in KO1, KO2, and EV HEC‐108 cell lysates (right) were measured by immunoblotting. Equal protein loading was confirmed by quantifying β‐actin (input control). Data are representative of 3 independent experiments and are shown as means ± SE (A,C,E). Student's t test: *P < .05, **P < .01
