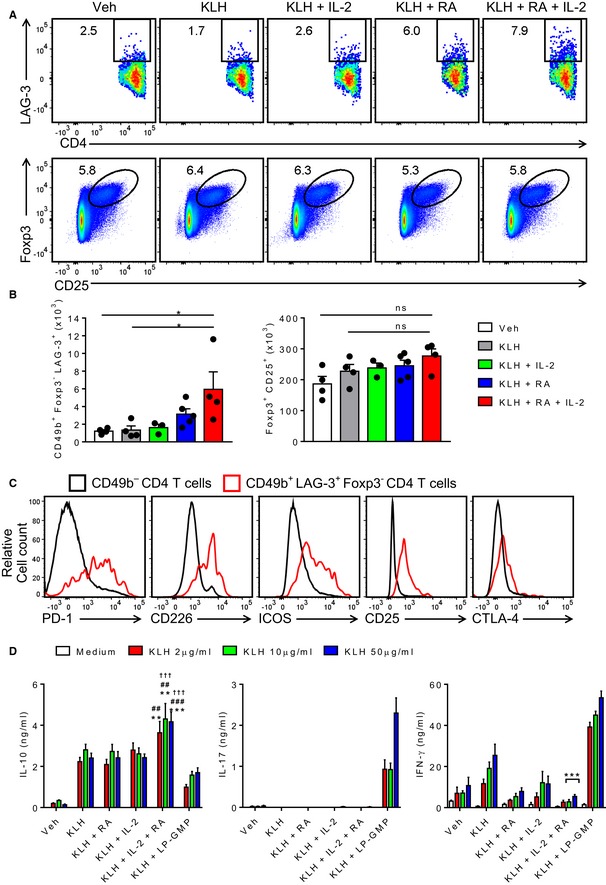
Ex vivo flow cytometry on LN cells of mice 7 days after two s.c. immunizations (14 days apart) with PBS + DMSO (Veh), KLH + DMSO (KLH), KLH + IL‐2, KLH + RA, KLH + RA + IL‐2. Results are representative FACS plots of LAG3+CD4+ or CD25+Foxp3+ cells after gating on live single CD3+CD4+CD49b+Foxp3− and live single CD3+CD4+ lymphocytes, respectively.
Mean absolute numbers of LAG‐3+CD49b+Foxp3− or CD25+Foxp3+ CD4 T cells in LNs as described in (A). Bars are mean + SEM (n = 3, 4 or 5). *P < 0.05 by one‐way ANOVA with Tukey post hoc test.
Expression of Tr1 markers PD‐1, CD226, ICOS, CD25 and CTLA‐4 on CD49b+ LAG‐3+ Foxp3−CD4+ T cells or on CD49b−CD4+ T cells.
IL‐10, IL‐17 and IFN‐γ production by ELISA on supernatants of spleen cells from mice immunized with PBS + DMSO (Veh), KLH + DMSO (KLH), KLH + RA, KLH + IL‐2, KLH + RA + IL‐2 or KLH + LP‐GMP (LP1569 + c‐di‐GMP) and cultured for 5 days with increasing concentrations of KLH. Bars are mean + SEM (n = 4 or 5). **P < 0.01, ***P < 0.001, KLH + IL‐2 + RA vs. KLH, ##
P < 0.01, ###
P < 0.001 KLH + IL‐2 + RA vs. KLH + RA, †††
P < 0.001 KLH + IL‐2 + RA vs. KLH + IL‐2 by two‐way ANOVA and Tukey post hoc test.

