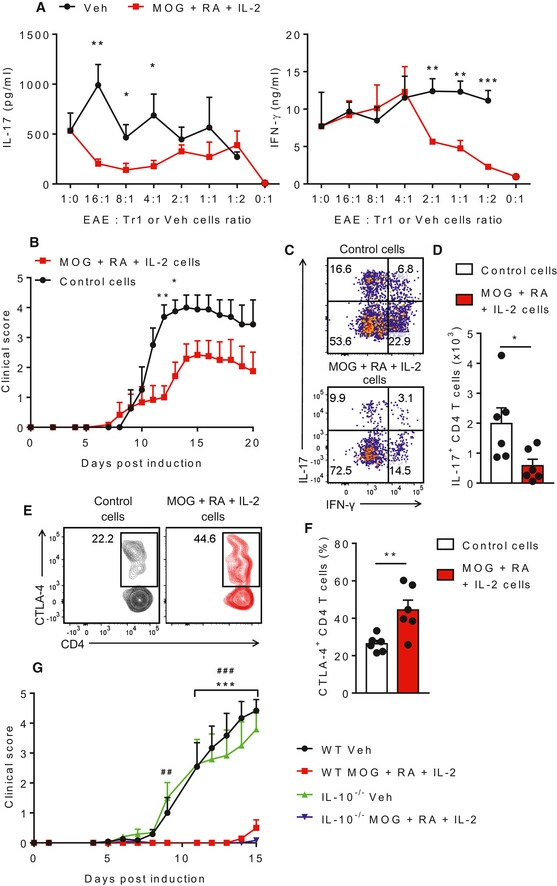
IL‐17 and IFN‐γ production by ELISA on supernatants of spleen cells from mice with EAE (EAE) co‐cultured for 3 days with MOG‐specific Tr1 cells (from mice immunized twice with MOG, RA and IL‐2 and amplified in vitro with MOG, RA and IL‐2 for 8 days) or control T cells from LNs of mice injected with PBS + DMSO (Veh). Bars are mean + SD of one experiment. *P < 0.05, **P < 0.01 and ***P < 0.001 by unpaired two‐tailed t‐test.
EAE clinical scores of mice transferred 1 day before induction of EAE with MOG‐specific Tr1 cells amplified in vitro with MOG, RA and IL‐2. Results are mean + SEM (n = 4 or 6). *P < 0.05 and **P < 0.01 by two‐way ANOVA with Bonferroni post hoc test.
Representative FACS plots of IL‐17+ and IFN‐γ+ CD4 T cells in the spinal cords on day 20 of EAE. Cells were gated as live single CD45.2+CD3+CD4+ cells.
Mean absolute numbers of IL‐17+ CD4 T cells in the spinal cords on day 20 of EAE. Results are mean + SEM (n = 6). *P < 0.05 by unpaired two‐tailed t‐test.
Representative FACS plots of CTLA‐4+ CD4 T cells in the spleens of mice with EAE. Cells were gated as live single CD45.1+CD3+CD4+.
Mean percentages of CTLA‐4+ CD4 T cells in the spleens of mice with EAE. Results are mean + SEM (n = 6). **P < 0.01 by unpaired two‐tailed t‐test.
EAE clinical scores of WT and IL‐10−/− mice immunized s.c. with MOG + RA + IL‐2, or PBS + DMSO (Veh), 7 and 21 days before induction of EAE. Results are mean + SEM (n = 6 or 7). ***P < 0.001, WT MOG + IL‐2 + RA vs. WT Veh, ##
P < 0.01, ###
P < 0.001, IL‐10−/− MOG + IL‐2 + RA vs. IL‐10−/− Veh by two‐way ANOVA and Tukey post hoc test.

