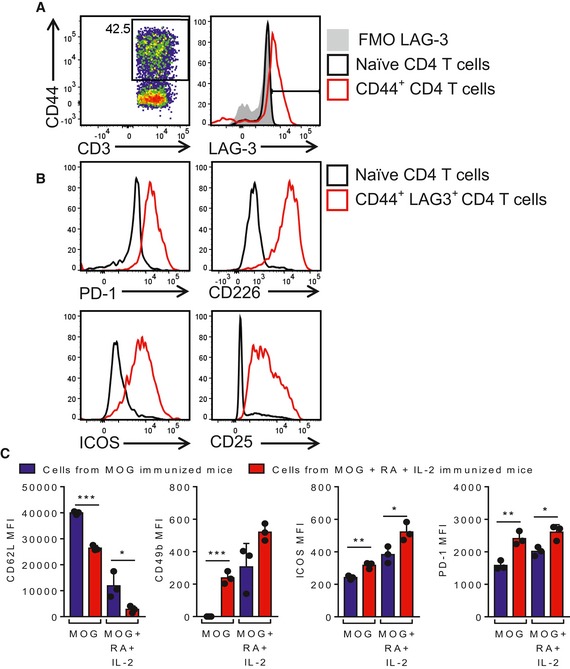
Representative FACS plots of CD44 expression in CD4 T cells and representative histogram of LAG‐3 expression by total CD4 and CD44+ CD4 T cells in naïve and amplified CD4 T cells, respectively. Amplified cells are LN cells of mice immunized twice with MOG, RA and IL‐2 and amplified in vitro with MOG, RA and IL‐2 for 8 days.
Representative histograms of PD‐1, CD226, ICOS and CD25 expression on naïve CD4 T cells and amplified CD44+ CD4 T cells from mice immunized with MOG, RA and IL‐2.
Mean fluorescence intensity (MFI) of CD62L, CD49b, ICOS and PD‐1 expression on naïve CD4 T cells and amplified CD44+ CD4 T cells from LNs of mice immunized twice with MOG (blue bars) or MOG, RA and IL‐2 (red bars) and amplified in vitro with MOG or MOG, RA and IL‐2 for 8 days. Results are mean + SD (n = 3). *P < 0.05, **P < 0.01, ***P < 0.001, by unpaired two‐tailed t‐test.
Data information: Cells were gated as single live CD3
+ CD4
+ (A, left panel), then CD44
+ (A, right panel and C) and CD44
+ LAG‐3
+ (B). FMO: Fluorescence Minus One.

